Visualization for Experiments
Introduction
Whether you’re an expert or a beginner, TensorFlow offers an end-to-end platform that makes it easy for you to build and deploy machine learning (ML) models. TensorBoard provides the visualization and tooling needed for ML experimentation, such as tracking and visualizing loss and accuracy metrics, displaying the model graph (ops and layers), showing images, text, and playing audio data, etc. It provides you with easy model building, robust ML prediction and powerful experimentation for research. You can learn more about the project on TensorBoard: TensorFlow’s visualization toolkit.
In this section, we introduce you some basic and powerful functionalities of TensorBoard by walking you through an example.
Get started
Download example notebook
Feel free to reuse the Notebook Server created in the previous sections. Connect to it and upload a new notebook downloaded from TensorBoard example.
Configure and run
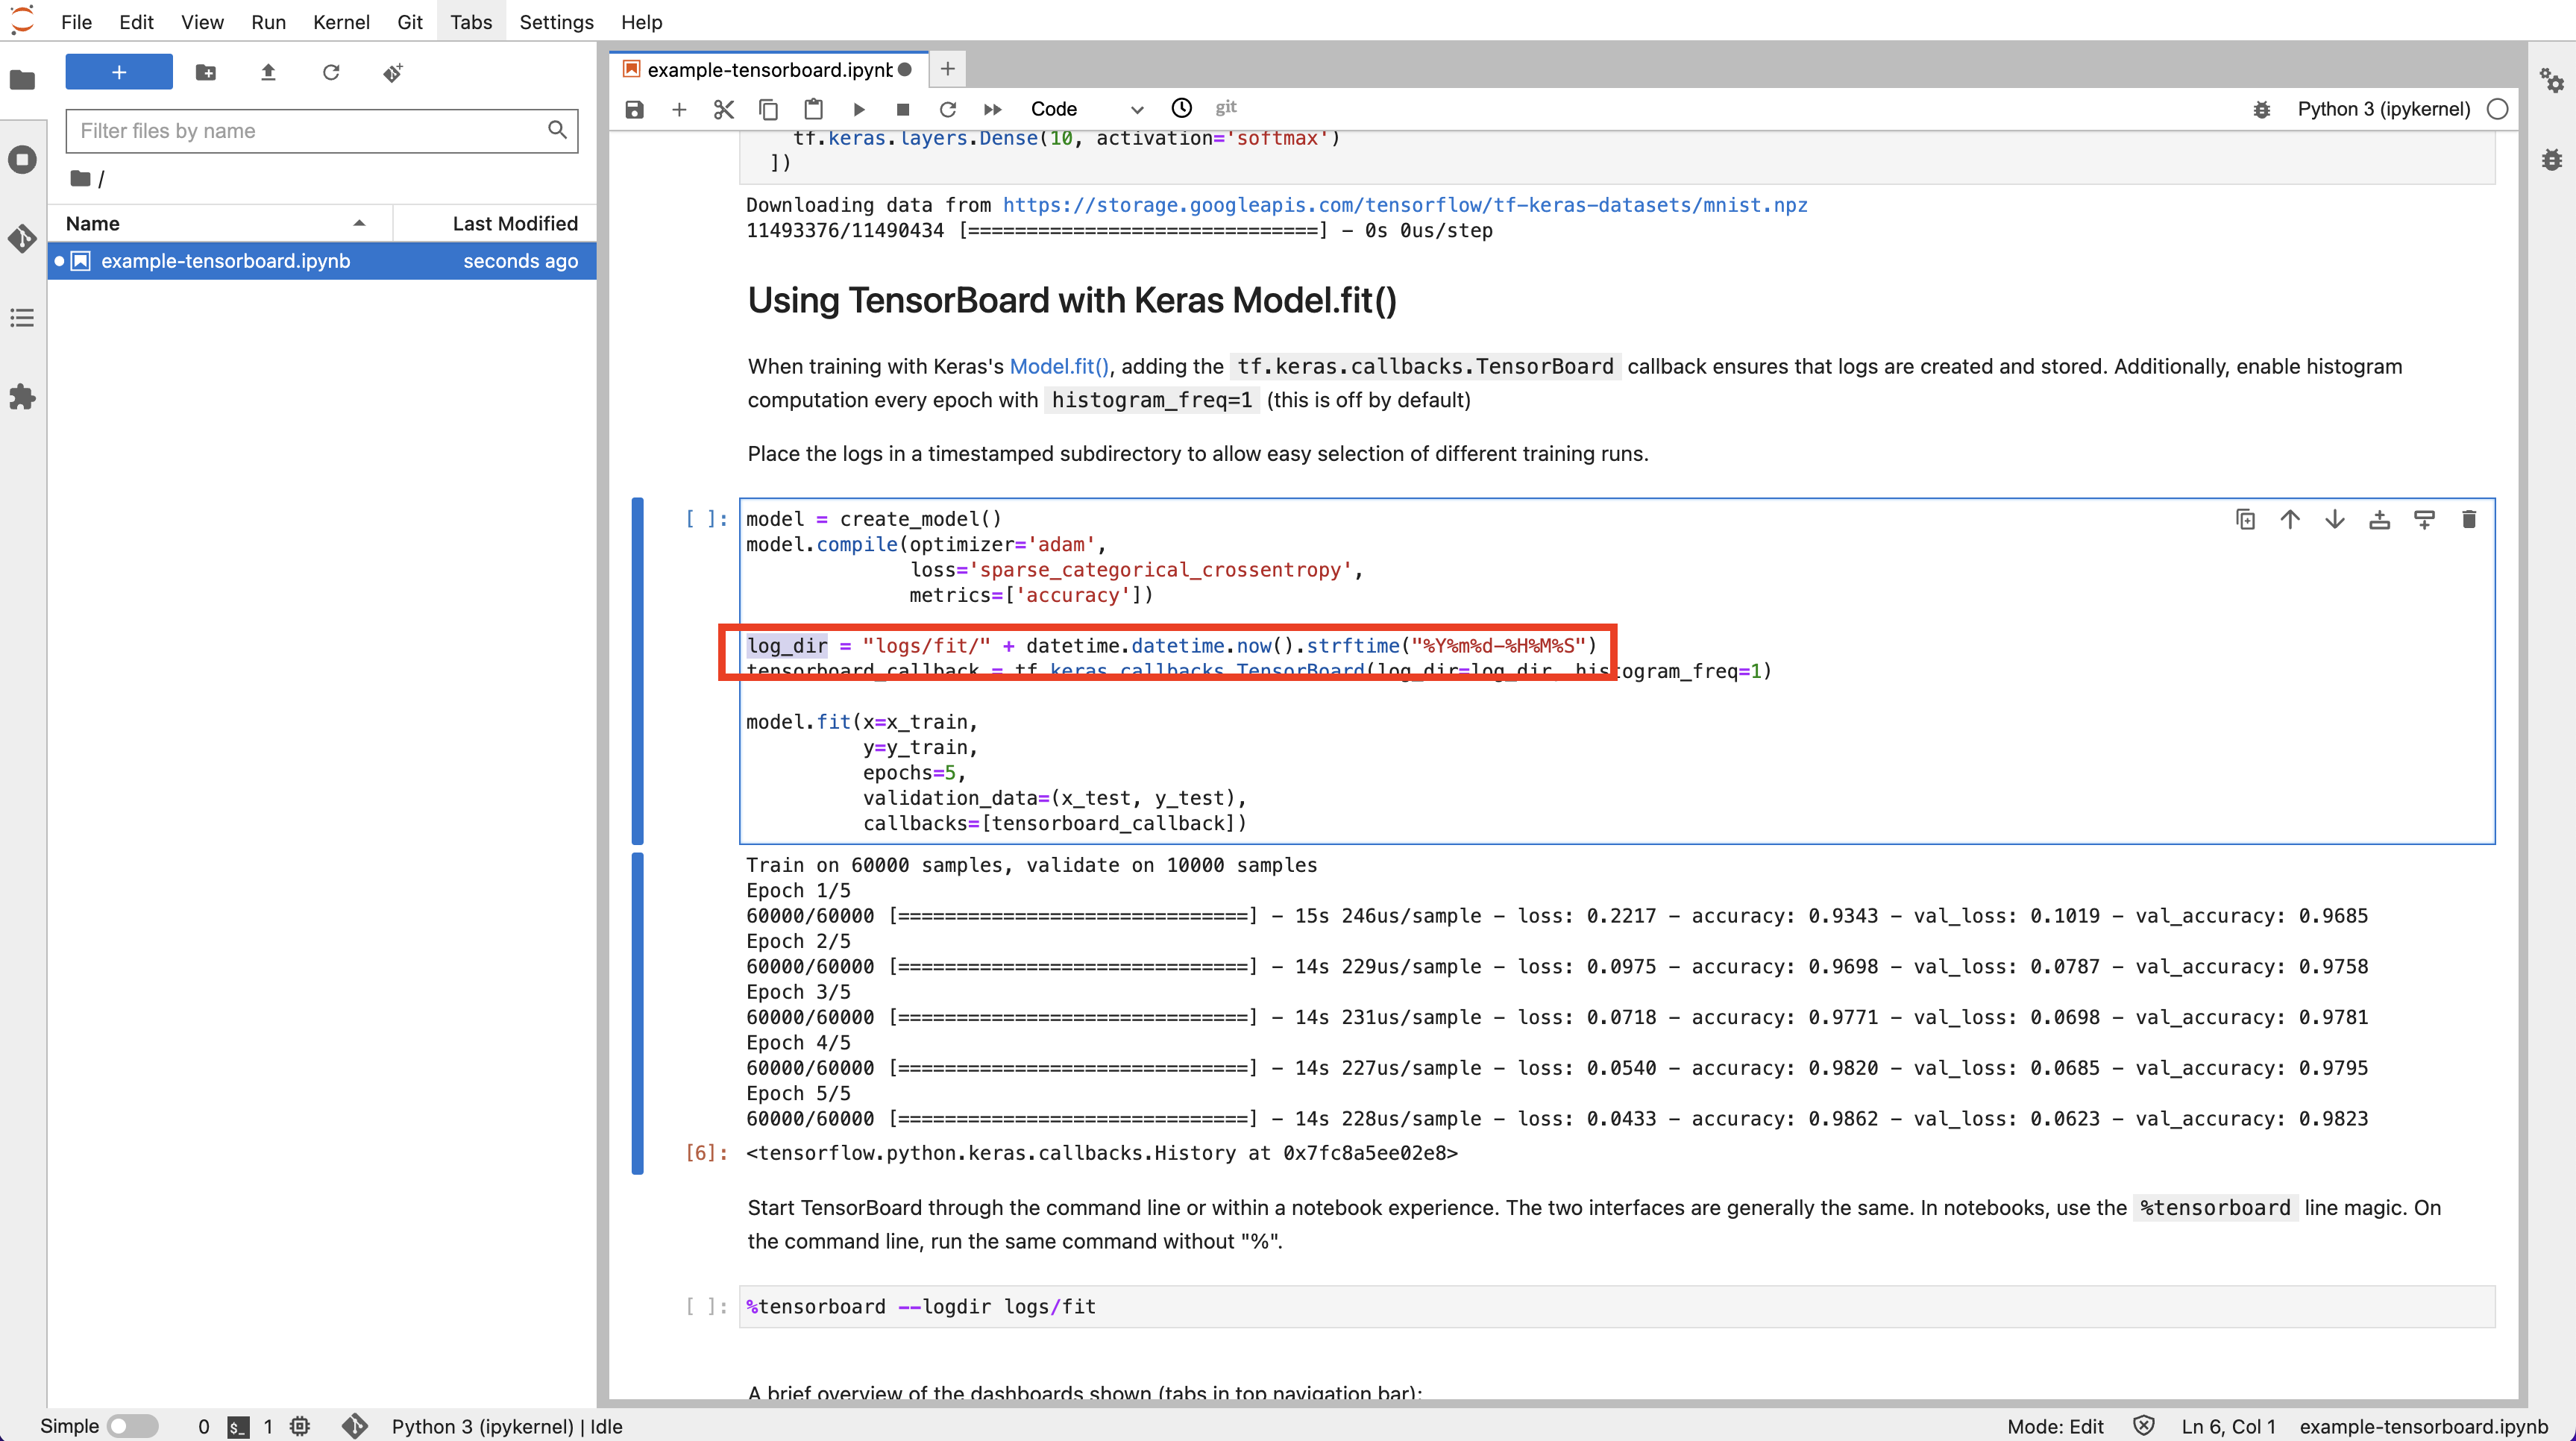
Go through the example notebook to have a better idea about what this example is working on.
Note
The log_dir path is important. It’s needed for TensorBoard creation.
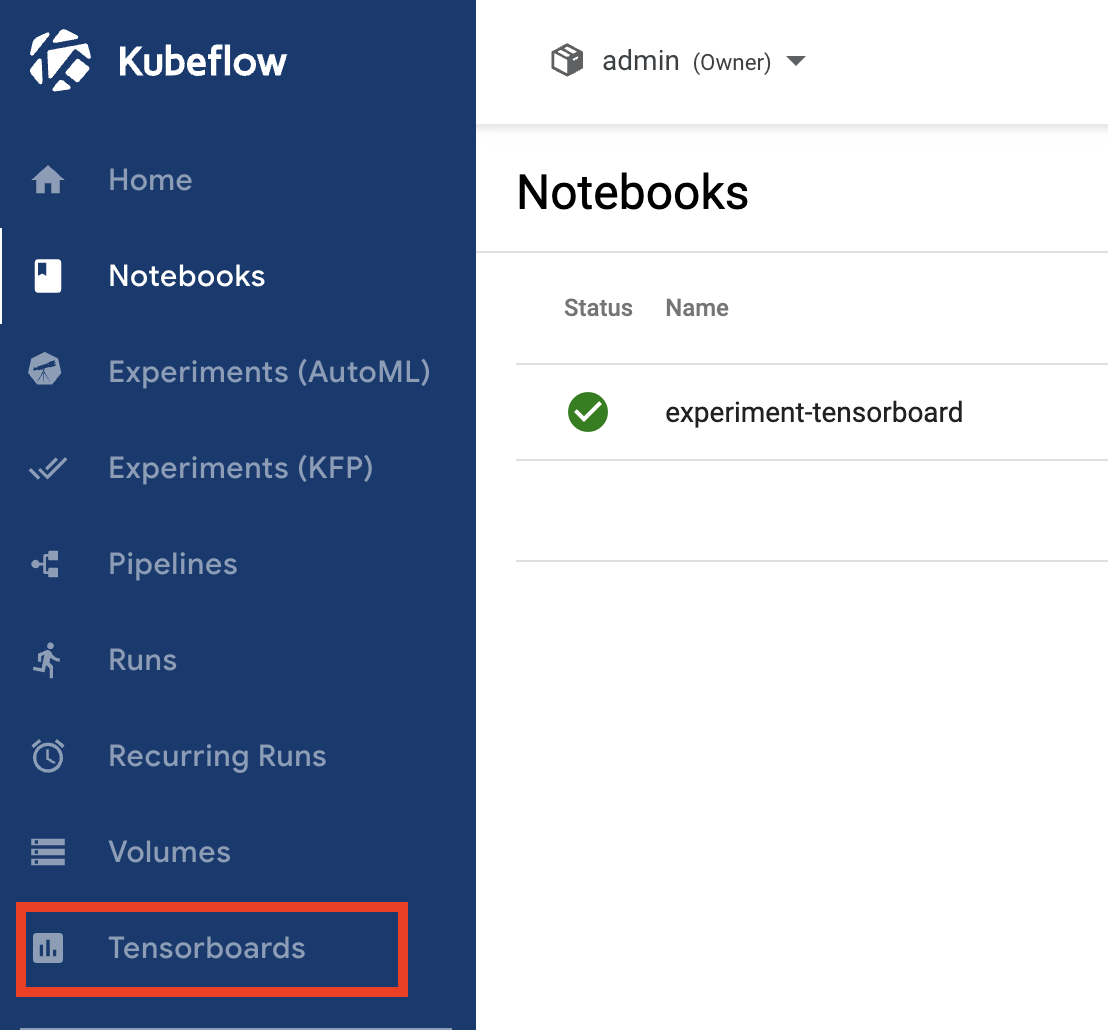
Run the notebook, and navigate to “Tensorboards” from left toolbar on Kubeflow on vSphere Dashboard UI.
Note
You may need to run pip install tensorflow to install TensorFlow package if you have not done so.
Click on “New Tensorboard”. Give it a name and tick the PVC checkbox. Select your notebook’s workspace volume from the dropdown list and
fill in the Mount Path field with the log_dir you have noted in the previous step. In this example, it’s logs/fit.
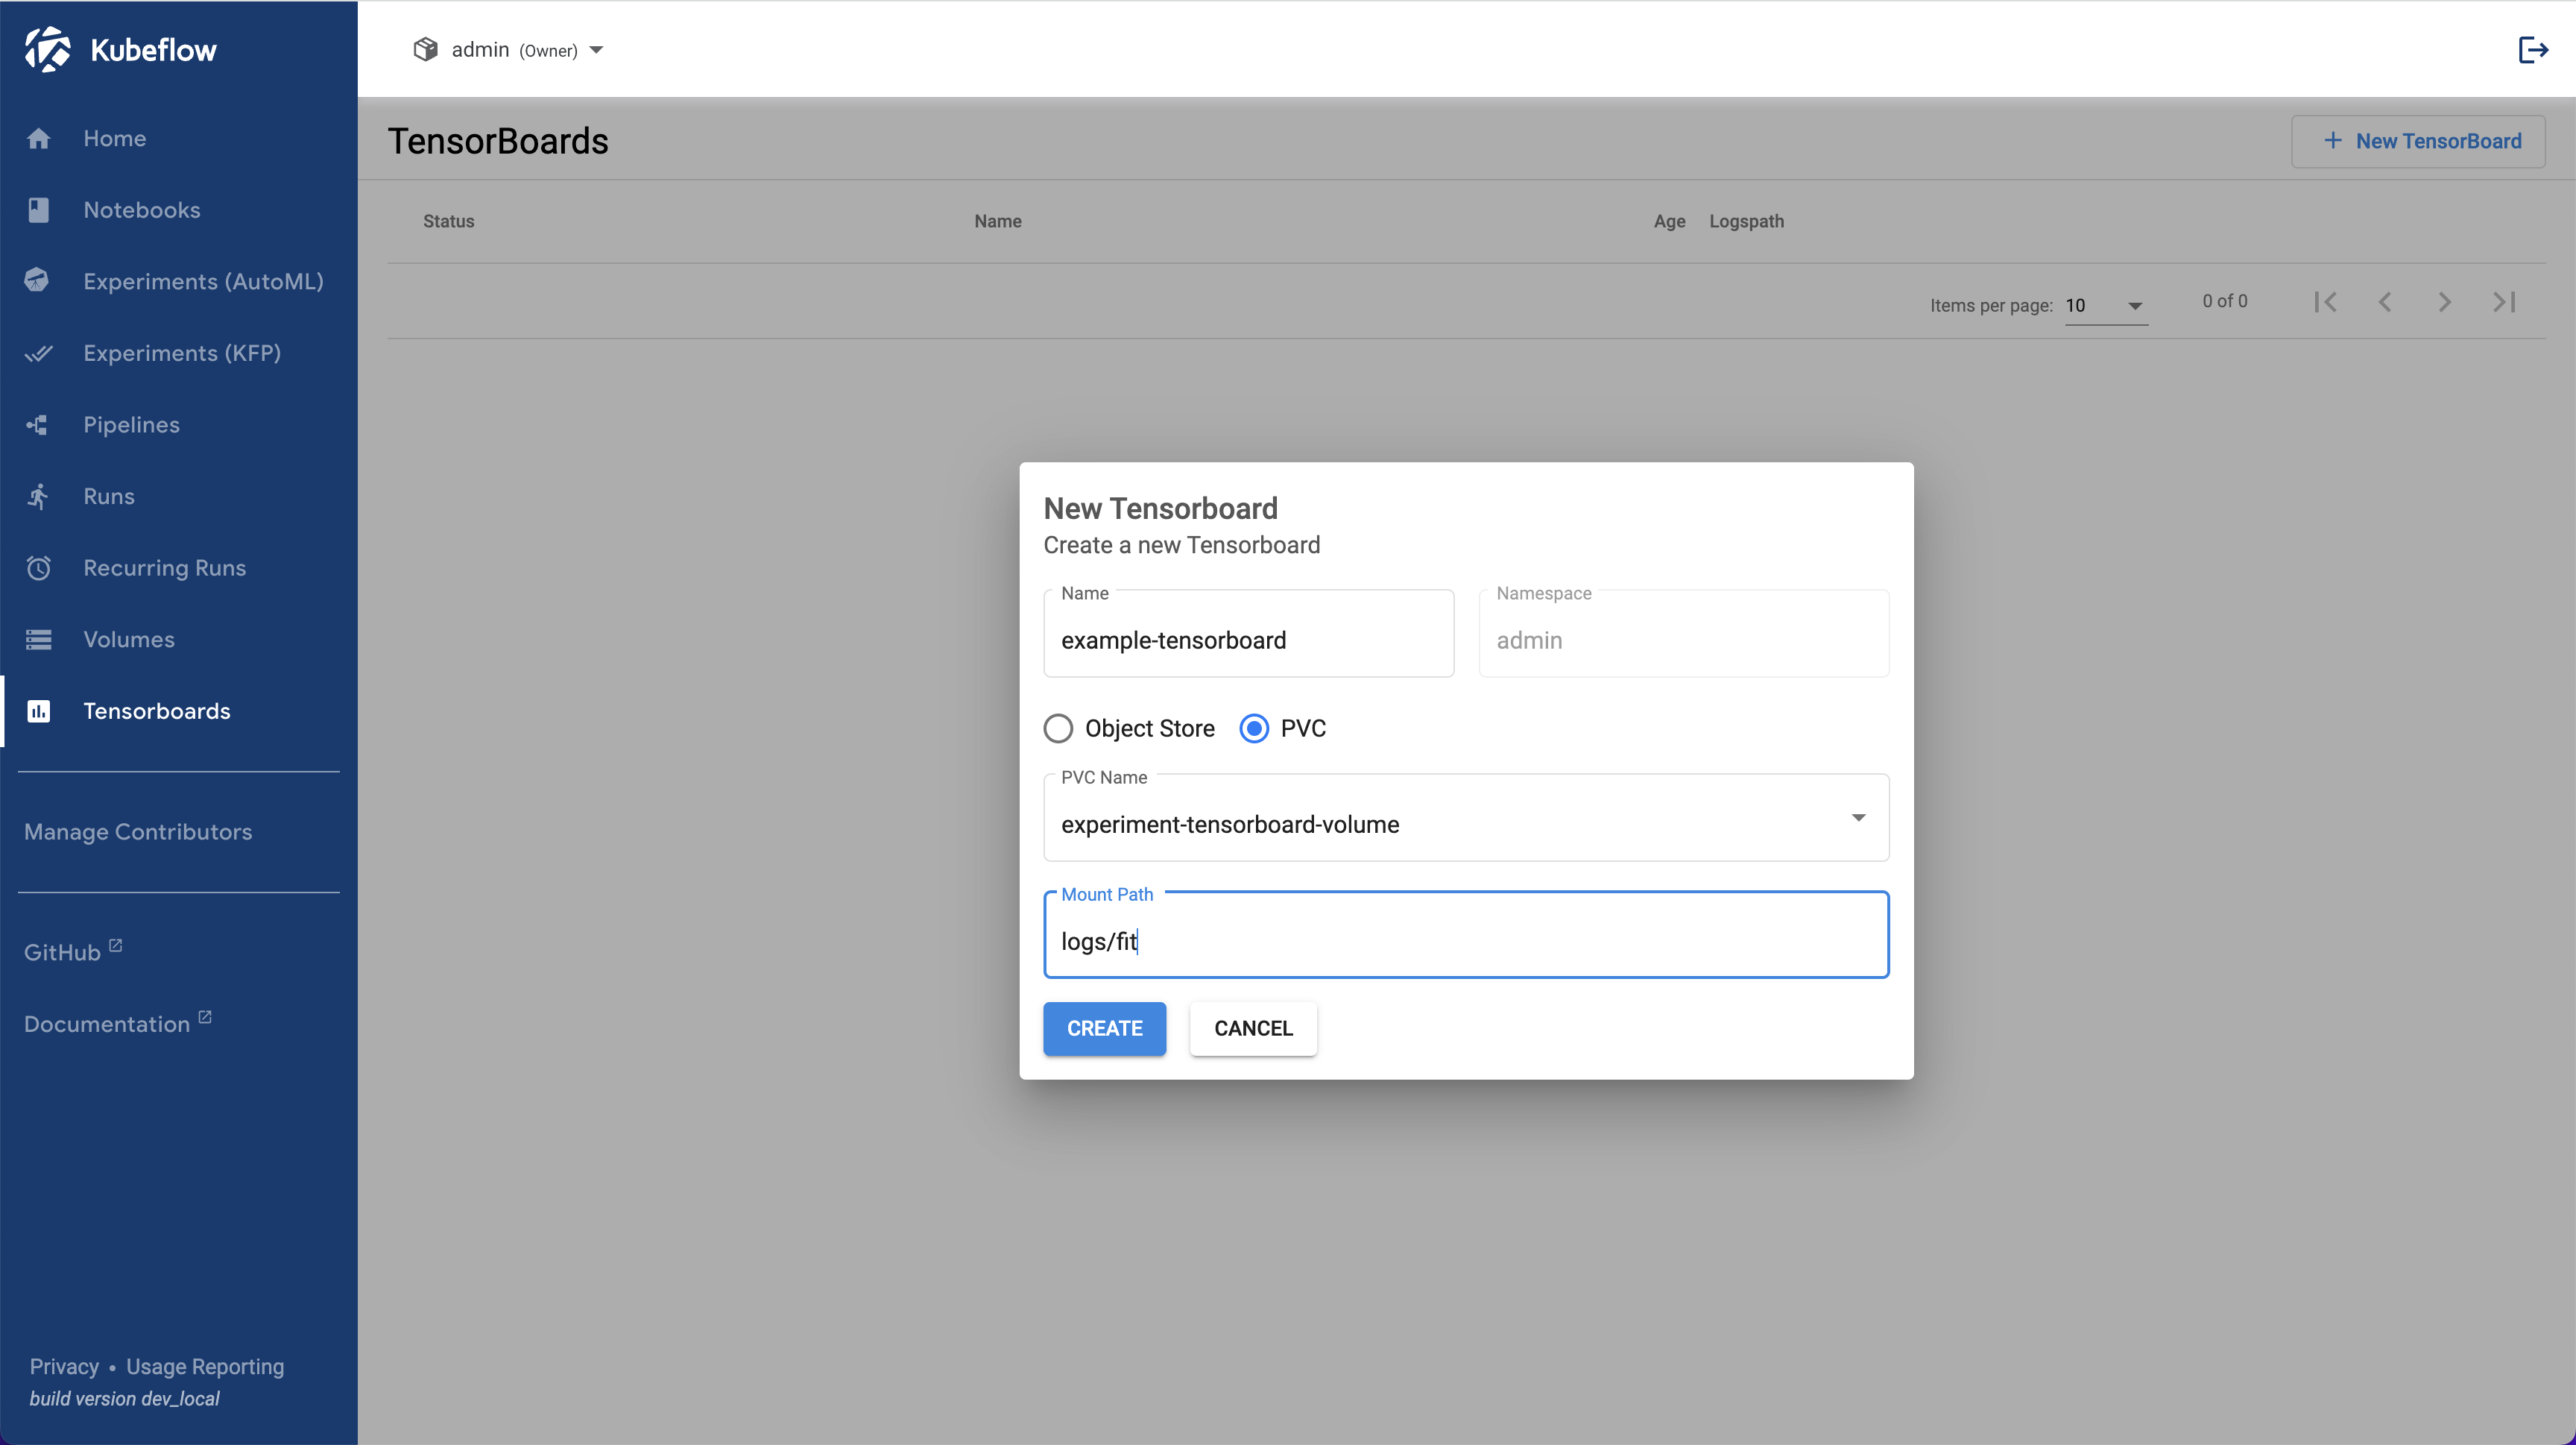
That’s it! Click on “CREATE” and your TensorBoard is up and running within minutes.
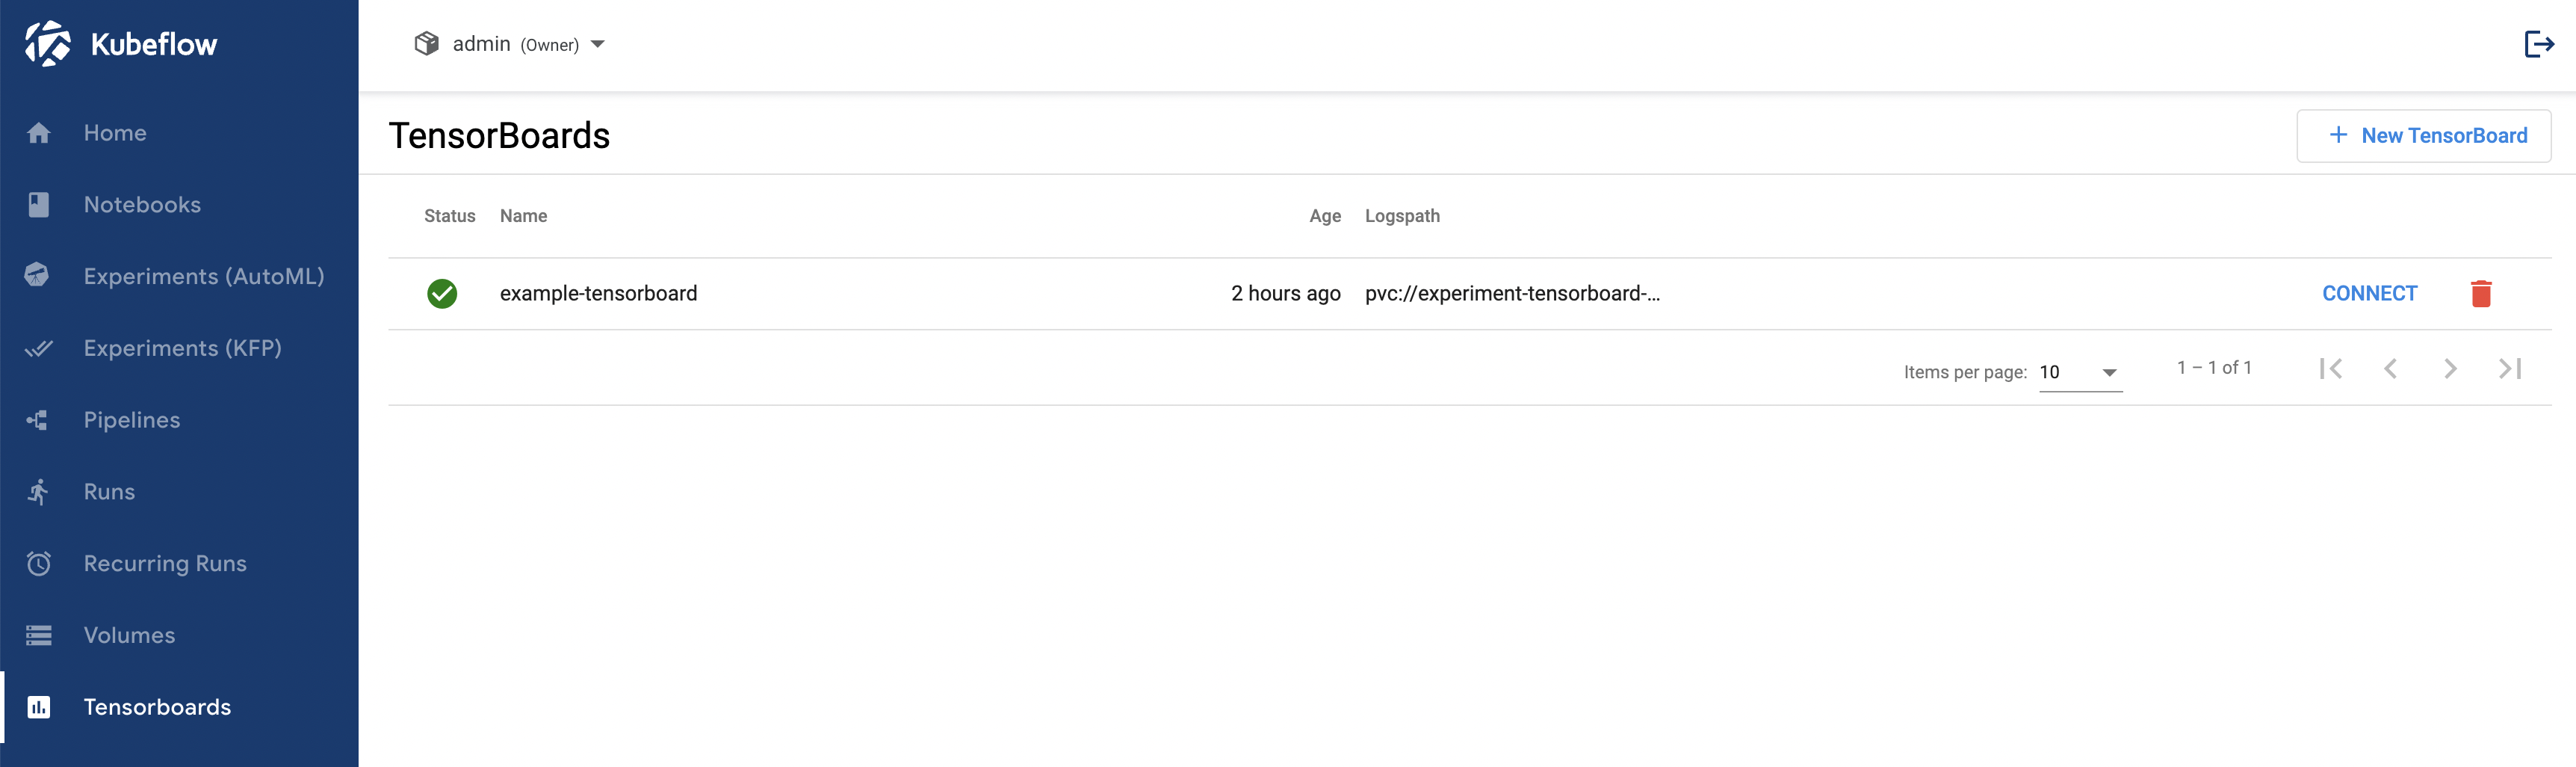
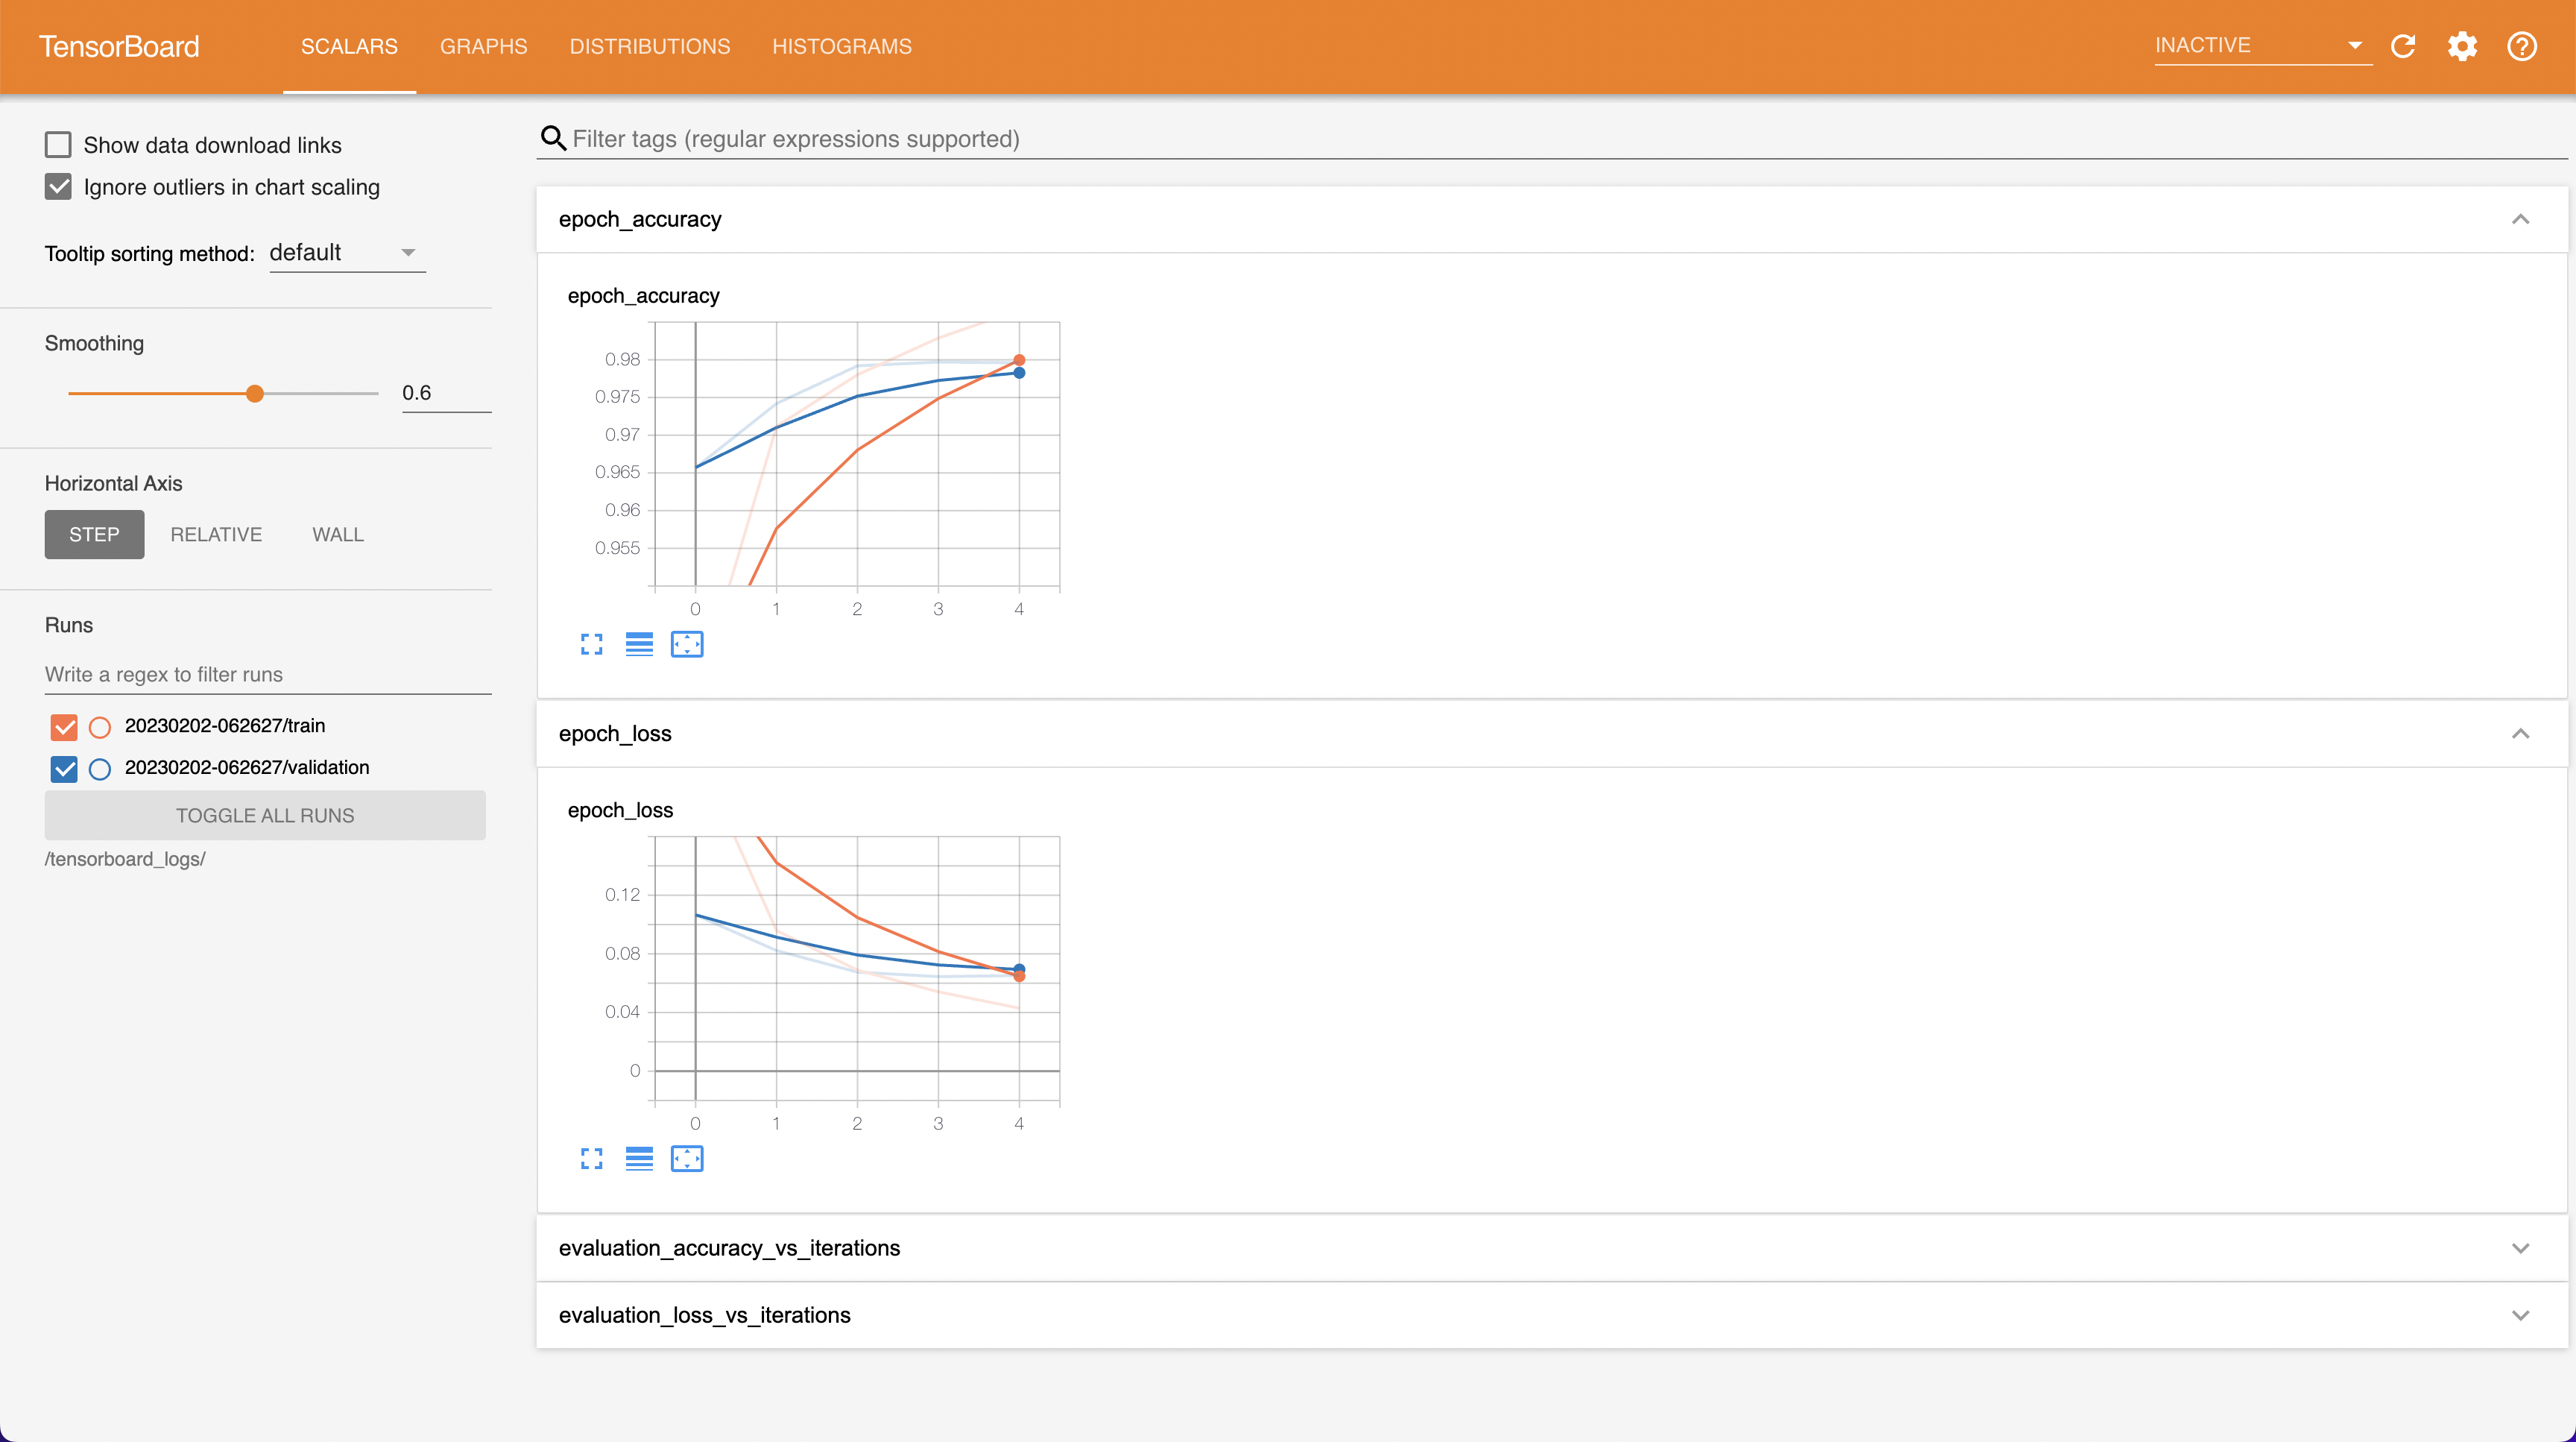
You then connect to it and see various metrics and graphs.