Monitoring with Prometheus and Grafana
This section explains how to use Prometheus and Grafana to monitor the Tanzu Kubernetes Grid (TKG) cluster in which Kubeflow on vSphere runs.
Prerequisites
A client host with the following commands installed:
kubectlandhelm.A TKG cluster running on vSphere, with the package repository installed. For information about deploying, see vSphere with Tanzu Configuration and Management.
Connect to the cluster from your client host. See Connect to a Tanzu Kubernetes Cluster as a vCenter Single Sign-On User.
Utilize and monitor GPU resources on vSphere, setup vGPU TKG following instructions in Deploy AI/ML Workloads on Tanzu Kubernetes Clusters.
Monitor with Prometheus and Grafana
Deploy Prometheus Operator and Grafana
Set up Prometheus
Deploying a Prometheus stack may seem a complex task, but leveraging the Helm package manager, along with the Prometheus Operator and kube-prometheus projects, can simplify the process. The Operator leverages predefined configurations and dashboards for Prometheus and Grafana, while the Helm prometheus-operator chart facilitates the installation of Prometheus Operator and all other needed components, resulting in a comprehensive monitoring solution.
First, add the Helm repo:
$ helm repo add prometheus-community https://prometheus-community.github.io/helm-charts
Then, search for available prometheus charts:
$ helm repo update
$ helm search repo kube-prometheus
After you locate which version of the chart to use, inspect the chart to modify the settings:
$ helm inspect values prometheus-community/kube-prometheus-stack > /tmp/kube-prometheus-stack.values
Next, edit the values file to change the port on which the Prometheus service is available. In the prometheus instance section of the chart, change the service type from ClusterIP to LoadBalancer. This allows the Prometheus server to be accessible at an external IP address.
From:
## Configuration for Prometheus service
##
service:
  ## Service type
  ##
  type: ClusterIP

To:
## Configuration for Prometheus service
##
service:
  ## Service type
  ##
  type: LoadBalancer
Set the prometheusSpec.serviceMonitorSelectorNilUsesHelmValues to false as below:
## If true, a nil or {} value for prometheus.prometheusSpec.serviceMonitorSelector will cause the
## prometheus resource to be created with selectors based on values in the helm deployment,
## which will also match the servicemonitors created
##
serviceMonitorSelectorNilUsesHelmValues: false
You can change Grafana’s default login password as below:
## Using default values from https://github.com/grafana/helm-charts/blob/main/charts/grafana/values.yaml
##
grafana:
  adminPassword: Grafana1!
Add the following ConfigMap to the section additionalScrapeConfigs in the Helm chart.
# AdditionalScrapeConfigs allows specifying additional Prometheus scrape configurations. Scrape configurations
# are appended to the configurations generated by the Prometheus Operator. Job configurations must have the form
# as specified in the official Prometheus documentation:
# https://prometheus.io/docs/prometheus/latest/configuration/configuration/#scrape_config. As scrape configs are
# appended, the user is responsible to make sure it is valid. Note that using this feature may expose the possibility
# to break upgrades of Prometheus. It is advised to review Prometheus release notes to ensure that no incompatible
# scrape configs are going to break Prometheus after the upgrade.
#
# The scrape configuration example below will find master nodes, provided they have the name .*mst.*, relabel the
# port to 2379 and allow etcd scraping provided it is running on all Kubernetes master nodes
#
additionalScrapeConfigs:
- job_name: gpu-metrics
  scrape_interval: 1s
  metrics_path: /metrics
  scheme: http
  kubernetes_sd_configs:
  - role: endpoints
    namespaces:
    names:
    - gpu-operator
  relabel_configs:
  - source_labels: [__meta_kubernetes_pod_node_name]
    action: replace
    target_label: kubernetes_node
Finally, deploy the Prometheus and Grafana pods using the kube-prometheus-stack via helm:
$ helm install --name-template kube-prometheus-stack prometheus-community/kube-prometheus-stack \
--create-namespace --namespace prometheus \
--values ./kube-prometheus-stack.values
You should see a console output as below:
Release "kube-prometheus-stack" does not exist. Installing it now.
NAME: kube-prometheus-stack
LAST DEPLOYED: Thu Apr 13 11:43:28 2023
NAMESPACE: prometheus
STATUS: deployed
REVISION: 1
NOTES:
kube-prometheus-stack has been installed. Check its status by running:
kubectl --namespace prometheus get pods -l "release=kube-prometheus-stack"

Visit https://github.com/prometheus-operator/kube-prometheus for instructions on how to create & configure Alertmanager and Prometheus instances using the Operator.
Now you can see the Prometheus and Grafana pods, ensure the pods are up and running and the validator pods have completed.
$ kubectl get pods -n prometheus

# NAME                                                       READY   STATUS    RESTARTS       AGE
# alertmanager-kube-prometheus-stack-alertmanager-0          2/2     Running   1 (4h7m ago)   4h7m
# kube-prometheus-stack-grafana-7f4454cfb6-fszwv             3/3     Running   0              4h8m
# kube-prometheus-stack-kube-state-metrics-bc98986bc-krs6l   1/1     Running   0              4h8m
# kube-prometheus-stack-operator-76c7894576-c9chq            1/1     Running   0              4h8m
# kube-prometheus-stack-prometheus-node-exporter-24g7f       1/1     Running   0              4h8m
# kube-prometheus-stack-prometheus-node-exporter-629fx       1/1     Running   0              4h8m
# kube-prometheus-stack-prometheus-node-exporter-wq72m       1/1     Running   0              4h8m
# prometheus-kube-prometheus-stack-prometheus-0 polish       2/2     Running   0              4h7m
Patch the Grafana Service
You can also launch the Grafana tools for visualizing the GPU metrics. By default, Grafana uses a ClusterIP to expose the ports on which the service is accessible. This can be changed to a LoadBalancer instead, so it is accessible from a browser, similar to the Prometheus dashboard.
$ cat << EOF | tee grafana-patch.yaml
spec:
  type: LoadBalancer
EOF
And use kubectl patch:
$ kubectl patch svc kube-prometheus-stack-grafana -n prometheus --patch "$(cat grafana-patch.yaml)"
You can verify that the service is exposed on an externally accessible port:
kubectl get service -n prometheus

# NAME                                             TYPE           CLUSTER-IP       EXTERNAL-IP     PORT(S)                      AGE
# alertmanager-operated                            ClusterIP      None             <none>          9093/TCP,9094/TCP,9094/UDP   3h3m
# kube-prometheus-stack-alertmanager               ClusterIP      198.57.226.217   <none>          9093/TCP                     3h4m
# kube-prometheus-stack-grafana                    LoadBalancer   198.59.238.246   10.105.150.43   80:31921/TCP                 3h4m
# kube-prometheus-stack-kube-state-metrics         ClusterIP      198.53.182.234   <none>          8080/TCP                     3h4m
# kube-prometheus-stack-operator                   ClusterIP      198.56.158.213   <none>          443/TCP                      3h4m
# kube-prometheus-stack-prometheus                 LoadBalancer   198.53.121.183   10.105.150.41   9090:31405/TCP               3h4m
# kube-prometheus-stack-prometheus-node-exporter   ClusterIP      198.57.47.214    <none>          9100/TCP                     3h4m
# prometheus-operated                              ClusterIP      None             <none>          9090/TCP                     3h3m
Deploy NVIDIA GPU Operator
If your cluster already installed the GPU operator, modify the clusterpolicy to enable the serviceMonitor as below:
$ kubectl edit clusterpolicy cluster-policy

# From
serviceMonitor:
  enabled: false

# To
serviceMonitor:
  enabled: true
If the GPU operator is not installed, use the following shell script to automate the GPU Operator installation process.
#!/bin/bash

dir=$( cd -- "$( dirname -- "${BASH_SOURCE[0]}" )" &> /dev/null && pwd )
cd "$dir"

# please filil in api key
NGC_API_KEY=

#1. Create namespace gpu-operator
kubectl create namespace gpu-operator
# 2. Prepare an empty file gridd.conf
touch gridd.conf
# 3. Create configmap
# 3.1. Prepare an empty file gridd.conf
# 3.2 Prepare your NLS client token file client_configuration_token.tok
[[ -e ./magpipeline/gpu_operator/nvaie/client_configuration_token.tok ]] || git clone git@gitlab.eng.vmware.com:magqe/magpipeline.git
# 3.3 Create configmap with above two files
kubectl create configmap licensing-config --from-file=./gridd.conf --from-file=./magpipeline/gpu_operator/nvaie/client_configuration_token.tok -n gpu-operator
# 4. Create secret
kubectl create secret docker-registry ngc-secret \
    --docker-server='nvcr.io/nvaie' \
    --docker-username='$oauthtoken' \
    --docker-password=$NGC_API_KEY \
    --docker-email=liy1@vmware.com \
    -n gpu-operator
# 5. Fetch GPU Operator Helm chart
helm fetch https://helm.ngc.nvidia.com/nvaie/charts/gpu-operator-3-0-v22.9.1.tgz \
    --username='$oauthtoken' \
    --password=$NGC_API_KEY
# 6. Install GPU Operator
helm install gpu-operator gpu-operator-3-0-v22.9.1.tgz -n gpu-operator

cat << EOF > patch.yaml
spec:
  template:
    spec:
      containers:
      - name: master
        image: harbor-repo.vmware.com/thunder/nfd/node-feature-discovery:v0.10.1
EOF
kubectl patch deployment.apps/gpu-operator-node-feature-discovery-master --patch-file=patch.yaml
cat << EOF > patch.yaml
spec:
  template:
    spec:
      containers:
      - name: worker
        image: harbor-repo.vmware.com/thunder/nfd/node-feature-discovery:v0.10.1
EOF
kubectl patch daemonset.apps/gpu-operator-node-feature-discovery-worker --patch-file=patch.yaml
Monitor the GPU Resource
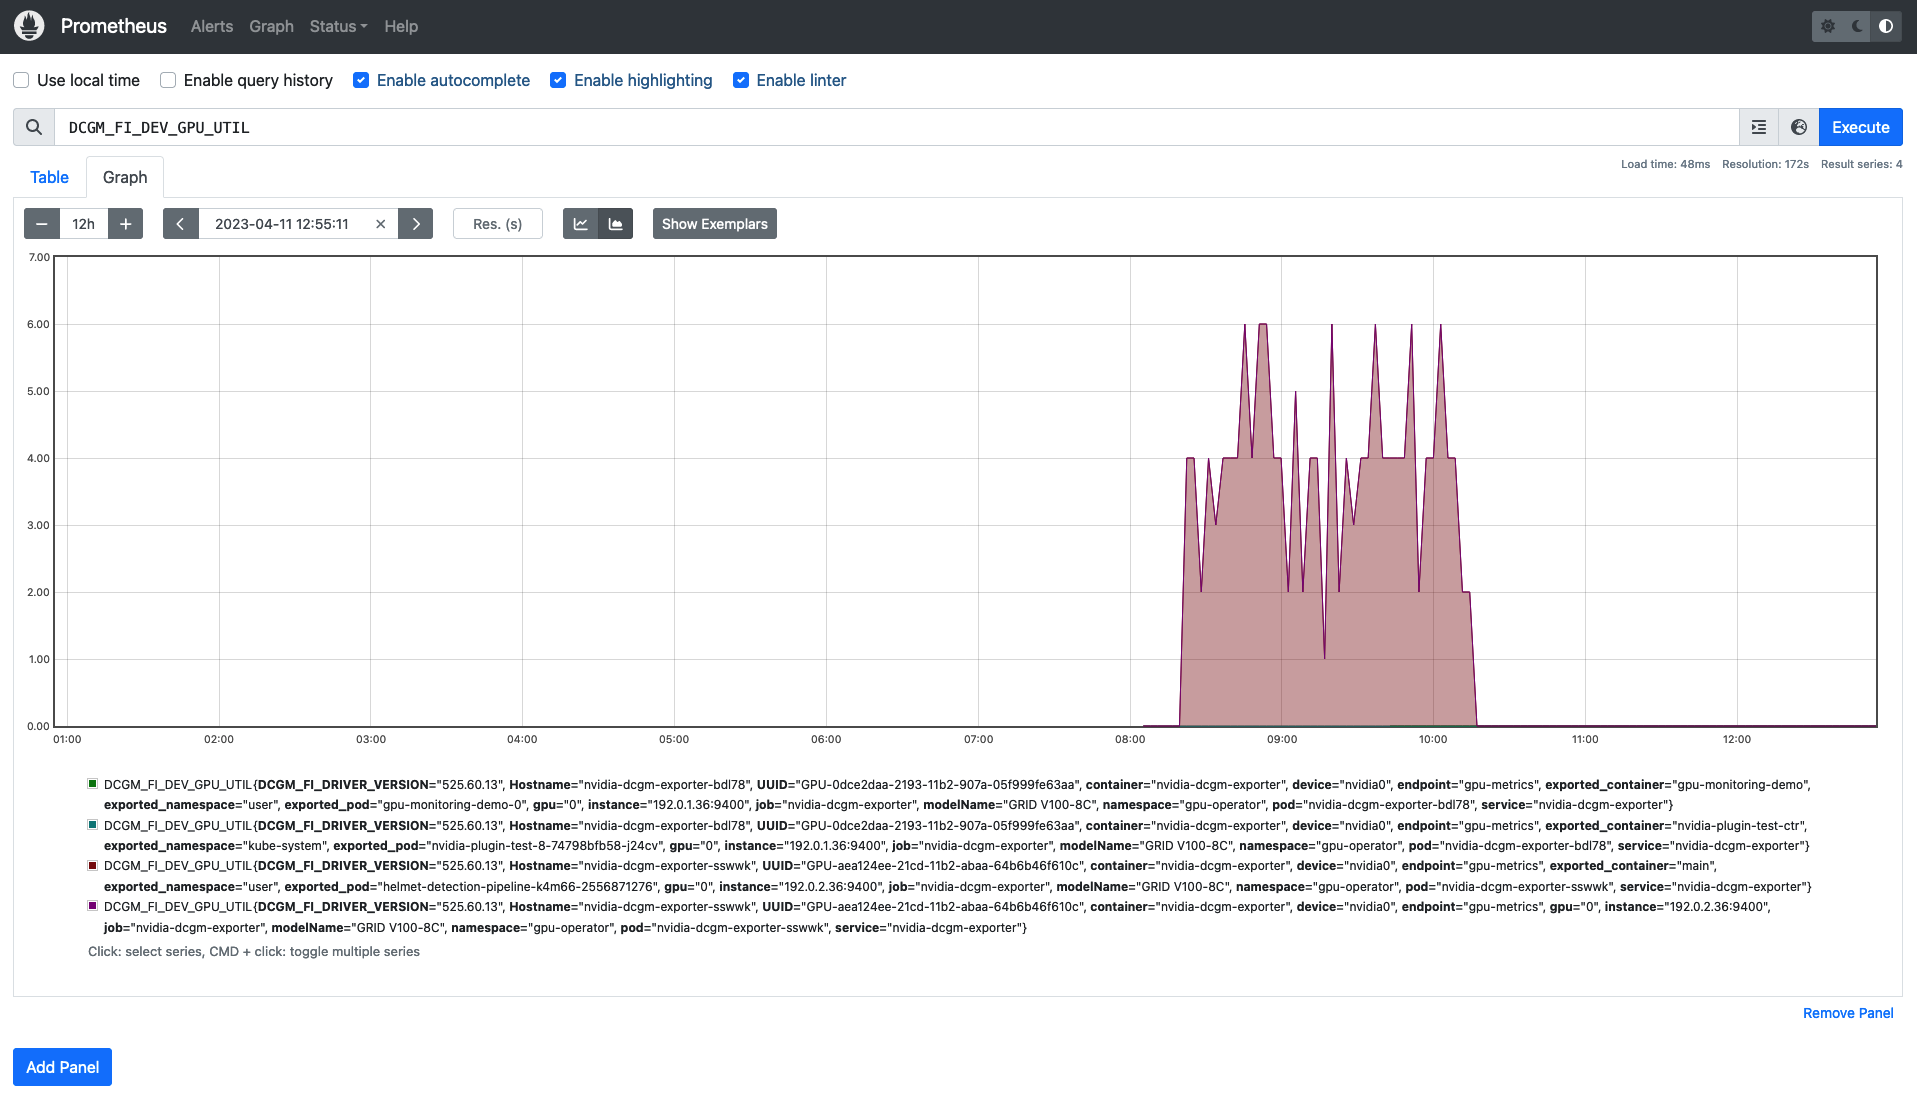
Now, the Prometheus server is available on port 9090 at the external IP address. Use your browser to visit http://<EXTERNAL-IP>:9090. It may take a few minutes for NVIDIA Data Center GPU Manager (DCGM) to start publishing the metrics to Prometheus. Type DCGM_FI_DEV_GPU_UTIL in the event bar to check if the GPU metrics are visible:
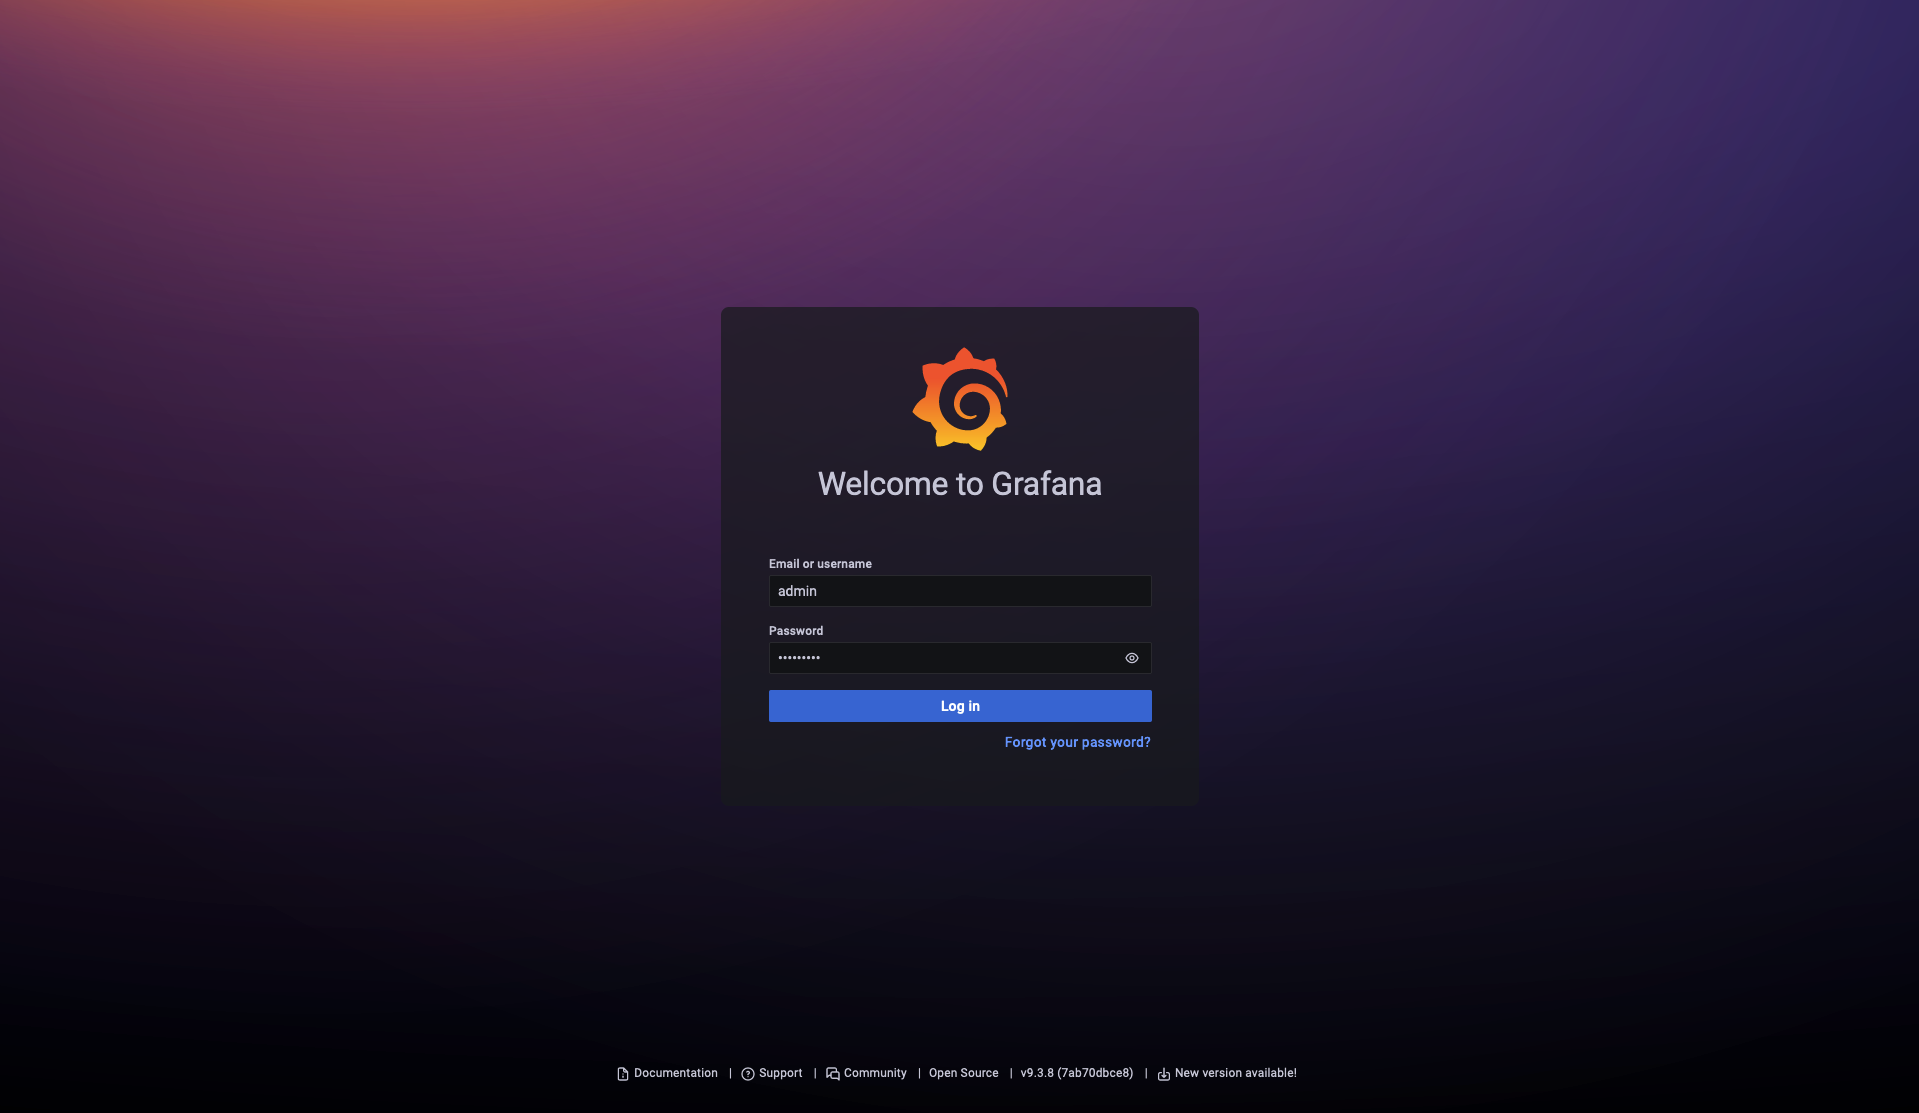
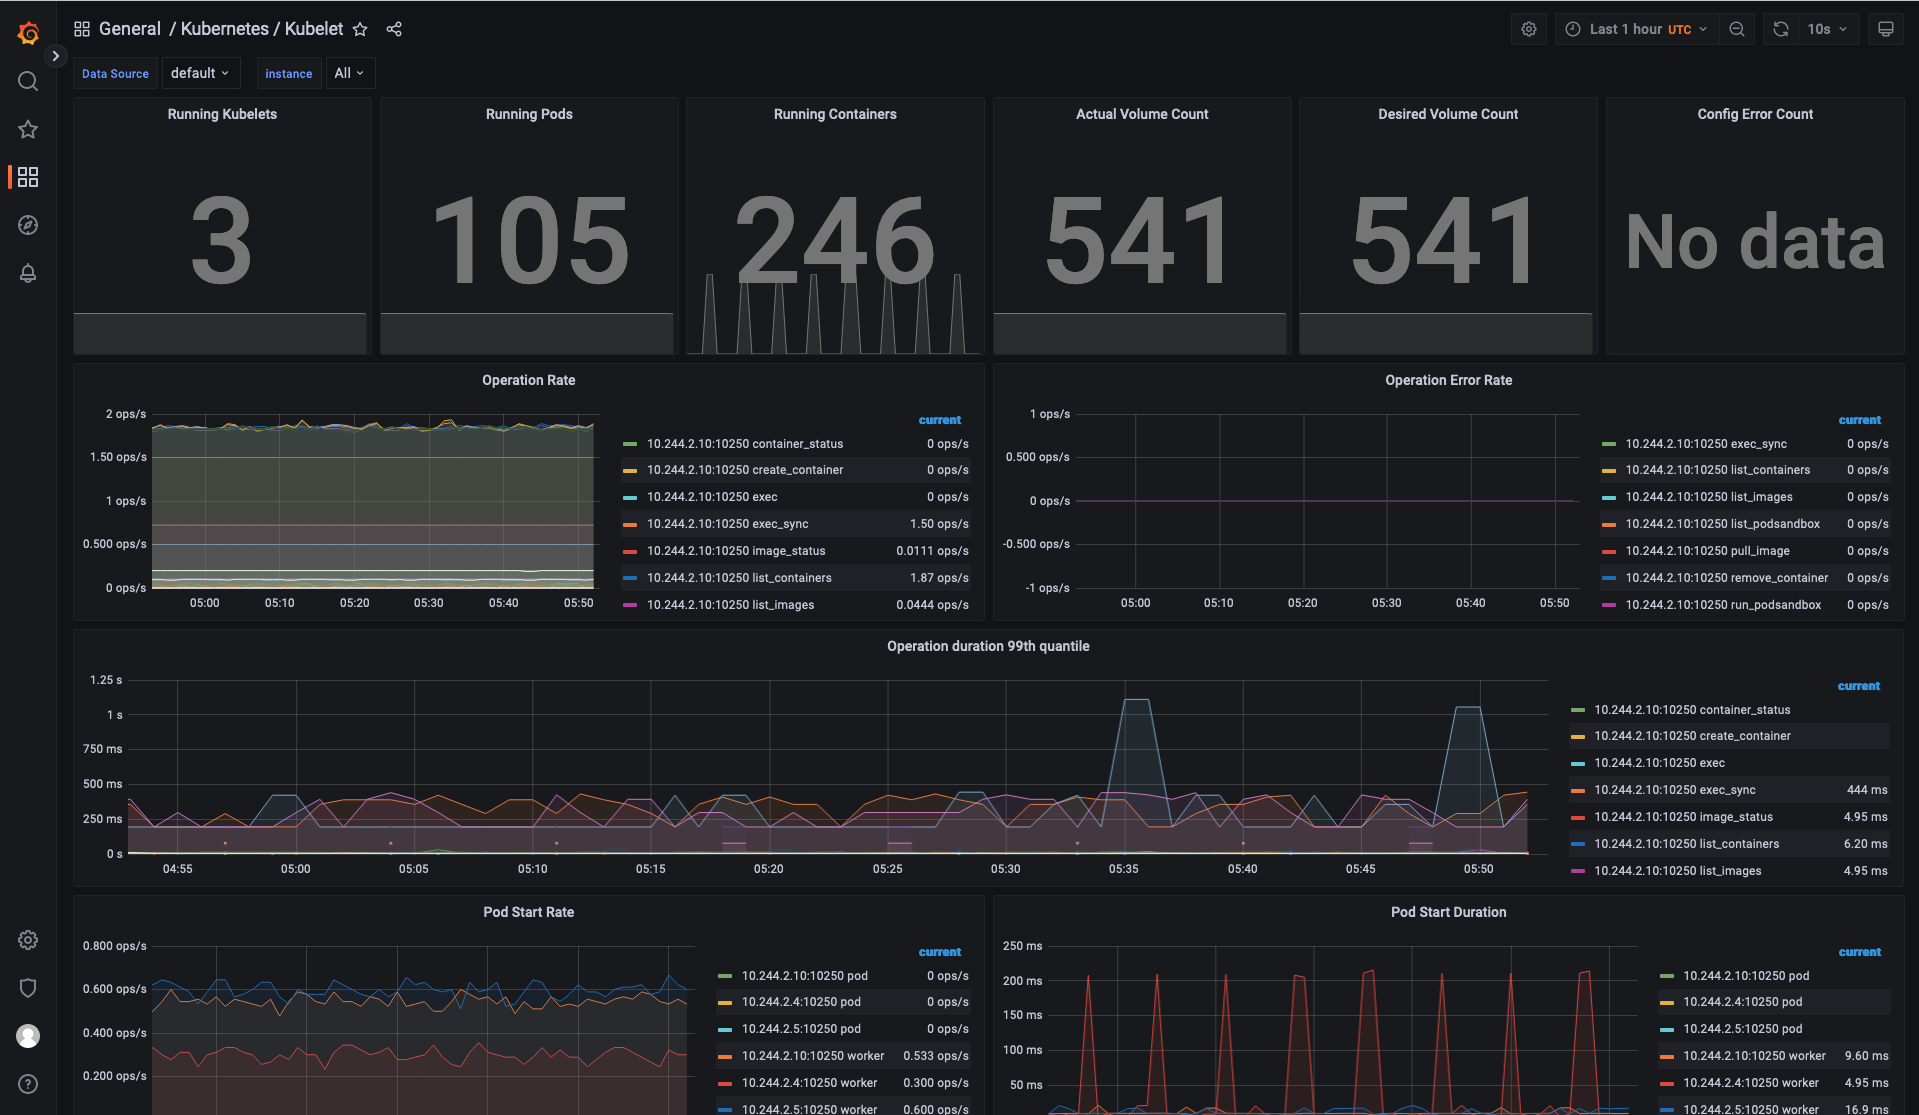
Use your browser to visit http://<EXTERNAL-IP>:80 to login to Grafana web UI with username
admin, the password credential is available in the prometheus.values file
edited earlier in this section:
Delete the Prometheus Chart
To remove all the Kubernetes components associated with the prometheus and grafana chart.
helm uninstall kube-prometheus-stack -n prometheus
kubectl delete ns prometheus