This is the multi-page printable view of this section. Click here to print.
Automation Tools
- 1: Powershell/PowerCLI
- 2: Chef InSpec/CINC
- 3: Ansible
- 4: SAF CLI
- 5: Heimdall
1 - Powershell/PowerCLI
PowerCLI is a command-line interface for managing and automating all aspects of vSphere management, including networking, storage, VMs, guest OS, and more. PowerCLI functions as a collection of PowerShell modules that contain more than 700 cmdlets (commands) to manage VMware infrastructure.
PowerCLI runs on top of PowerShell, which is a cross-platform task automation and configuration management framework. It consists of a command-line shell and a scripting language. PowerCLI uses PowerShell’s basic syntax and concepts.
Prerequisites
- PowerShell version 5.1 or later is required to run PowerCLI cmdlets.
- Powershell comes installed on Windows and Windows Server by default.
- For Linux and MAC Powershell must be installed.
For more information, see the PowerCLI Compatability matrixes.
Installation
Online
You can install PowerCLI directly from the PowerShell Gallery.
# Run the following command from a Powershell prompt
Install-Module -Name VMware.PowerCLI
Offline
Download the .zip file with the latest released PowerCLI version from here.
# To retrieve the folder(s) on your machine that contain PowerShell modules, run the following command.
$env:PSModulePath

# Extract the downloaded .zip file to one of the listed folders.

# Unblock the copied files
cd path_to_powershell_modules_folder Get-ChildItem * -Recurse | Unblock-File

# Verify if the PowerCLI module is available on your system.
Get-Module -Name VMware.PowerCLI -ListAvailable
Basic Usage
PowerCLI includes cmdlets to connect to supported VMware products. This must be done before any other PowerCLI cmdlets can be run successfully.
Connect to vCenter or ESXi directly
# Connects to a vSphere server by using the User and Password parameters.
Connect-VIServer -Server 10.23.112.235 -Protocol https -User admin -Password pass

# Connects to a vSphere server by using a credential object.
$cred = Get-Credential
Connect-VIServer -Server 10.23.112.235 -Protocol https -Credential $cred
References
For the full PowerCLI documentation, see the PowerCLI Installation Guide
2 - Chef InSpec/CINC
Chef InSpec is an open-source framework for testing and auditing your applications and infrastructure. Chef InSpec works by comparing the actual state of your system with the desired state that you express in easy-to-read and easy-to-write Chef InSpec code. Chef InSpec detects violations and displays findings in the form of a report, but puts you in control of remediation.
Cinc is a recursive acronym for CINC Is Not Chef. Chef InSpec is free for non-commercial use so the Cinc project was able to remove any trademarks while still complying with Chef’s policies and offer a free for any use alternative. Cinc Auditor is built off the same code base as Chef InSpec.
Why InSpec?
Chef InSpec/CINC Auditor is currently being utilized to assess products as it is geared specifically towards compliance auditing and reporting. It is also something our DoD customers can use, along with the supporting tools from the MITRE Security Automation Framework, to create artifacts needed to accredit their environments.
Additionally, using a separate tool than what is used to fix or remediate controls is good practice and provides additional assurances that the configuration is in an agreed upon state from multiple points of view. One can think of this similar to a home builder and inspector where we don’t rely on a builder to inspect things and tell us they are up to code.
Prerequisites
- Windows, Linux, and MAC are supported.
Installation
Online
Windows
# Run the following command from a Powershell prompt
. { iwr -useb https://omnitruck.chef.io/install.ps1 } | iex; install -project inspec
Linux
curl https://omnitruck.chef.io/install.sh | sudo bash -s -- -P inspec
Offline
Download the package for your OS here.
Concepts
Profiles
In InSpec terms we offer “profiles” to audit products. Simple profiles have the following structure:
examples/profile
├── README.md
├── controls
│   ├── example.rb
│   └── control_etc.rb
├── libraries
│   └── extension.rb
|── files
│   └── extras.conf
└── inspec.yml
The inspec.yml file includes some metadata about the profile and any inputs(variables) and dependencies.
Inputs provide a way for us to provide values to tests without having to update the test to do so. For example, we may have an input for a syslog server to check that the correct syslog server for your environment is configured. Inputs can be given as an argument at the cli or in an inputs file that is then provided at the cli as well. We recommend using an inputs file because it is easier to manage and provide at the cli.
Dependent Profiles
In many cases our profiles are really made up of multiple profiles that are included in the same folder structure but can also be pulled in from another location.
We do this when a product may have multiple STIGs that we would like to audit together but also separate into its own profile for organizational purposes. Another reason to do this is it makes profile reuse easier like with Photon OS which many of our product appliances are based on. Instead of maintaining a profile for Photon with each product we can maintain Photon separately and it can be called as a dependency in a product’s profile and then provided inputs and tweaked as needed for that specific product.
If we look at the vSphere 7 VCSA profile we will see an example of this.
An abbreviated structure for this profile.
vmware-vcsa-7.0-stig-baseline
├── README.md
├── controls
│   ├── eam.rb
│   └── photon.rb
├── eam
  ├── README.md
  ├── controls
  │   ├── VCEM-70-000001.rb
  │   └── VCEM-70-000002.rb
  ├── libraries
  │   └── extension.rb
  |── files
  │   └── extras.conf
  └── inspec.yml
├── photon
  ├── README.md
  ├── controls
  │   ├── PHTN-30-000001.rb
  │   └── PHTN-30-000002.rb
  ├── libraries
  │   └── extension.rb
  |── files
  │   └── extras.conf
  └── inspec.yml
└── inspec.yml
For more information on dependent profiles, see Profile Dependencies.
InSpec Vendoring
Dependent profiles are “vendored” or cached into the /vendor folder in the profile. This is important to pay attention to because if changes are made to dependent profiles and this cache is not updated you will not see the changes when you run the profile though the parent.
Update the vendor/cache.
inspec vendor --overwrite
Dependencies for profile /vmware-vcsa-7.0-stig-baseline successfully vendored to /vmware-vcsa-7.0-stig-baseline/vendor
Controls
For the profiles we develop, the controls folder contains a file for each STIG control that includes that controls metadata and a test for auditing.
Example control file
control 'ESXI-70-000001' do
  title 'Access to the ESXi host must be limited by enabling lockdown mode.'
  desc  "
    Enabling lockdown mode disables direct access to an ESXi host, requiring the host to be managed remotely from vCenter Server. This is done to ensure the roles and access controls implemented in vCenter are always enforced and users cannot bypass them by logging on to a host directly.

    By forcing all interaction to occur through vCenter Server, the risk of someone inadvertently attaining elevated privileges or performing tasks that are not properly audited is greatly reduced.
  "
  desc  'rationale', ''
  desc  'check', "
    For environments that do not use vCenter server to manage ESXi, this is not applicable.

    From the vSphere Client, go to Hosts and Clusters.

    Select the ESXi Host >> Configure >> System >> Security Profile.

    Scroll down to \"Lockdown Mode\" and verify it is set to \"Enabled\" (Normal or Strict).

    or

    From a PowerCLI command prompt while connected to the ESXi host, run the following command:

    Get-VMHost | Select Name,@{N=\"Lockdown\";E={$_.Extensiondata.Config.LockdownMode}}

    If \"Lockdown Mode\" is disabled, this is a finding.
  "
  desc 'fix', "
    From the vSphere Client, go to Hosts and Clusters.

    Select the ESXi Host >> Configure >> System >> Security Profile >> Lockdown Mode.

    Click \"Edit...\". Select the \"Normal\" or \"Strict\" radio buttons.

    or

    From a PowerCLI command prompt while connected to the ESXi host, run the following commands:

    $level = \"lockdownNormal\" OR \"lockdownStrict\"
    $vmhost = Get-VMHost -Name <hostname> | Get-View
    $lockdown = Get-View $vmhost.ConfigManager.HostAccessManager
    $lockdown.ChangeLockdownMode($level)

    Note: In strict lockdown mode, the Direct Console User Interface (DCUI) service is stopped. If the connection to vCenter Server is lost and the vSphere Client is no longer available, the ESXi host becomes inaccessible.
  "
  impact 0.5
  tag severity: 'medium'
  tag gtitle: 'SRG-OS-000027-VMM-000080'
  tag satisfies: ['SRG-OS-000123-VMM-000620']
  tag gid: 'V-256375'
  tag rid: 'SV-256375r885906_rule'
  tag stig_id: 'ESXI-70-000001'
  tag cci: ['CCI-000054', 'CCI-001682']
  tag nist: ['AC-10', 'AC-2 (2)']

  vmhostName = input('vmhostName')
  cluster = input('cluster')
  allhosts = input('allesxi')
  vmhosts = []

  unless vmhostName.empty?
    vmhosts = powercli_command("Get-VMHost -Name #{vmhostName} | Sort-Object Name | Select -ExpandProperty Name").stdout.split
  end
  unless cluster.empty?
    vmhosts = powercli_command("Get-Cluster -Name '#{cluster}' | Get-VMHost | Sort-Object Name | Select -ExpandProperty Name").stdout.split
  end
  unless allhosts == false
    vmhosts = powercli_command('Get-VMHost | Sort-Object Name | Select -ExpandProperty Name').stdout.split
  end

  if !vmhosts.empty?
    list = ['lockdownNormal', 'lockdownStrict']
    vmhosts.each do |vmhost|
      command = "(Get-VMHost -Name #{vmhost}).Extensiondata.Config.LockdownMode"
      describe powercli_command(command) do
        its('stdout.strip') { should be_in list }
      end
    end
  else
    describe 'No hosts found!' do
      skip 'No hosts found...skipping tests'
    end
  end
end
Train (Transport Interfaces)
Train Plugins allow InSpec to connect to various types of endpoints for auditing. Some common plugins are:
- Local execution
- SSH
- WinRM
- Docker and Podman
- Mock (for testing and debugging)
- AWS as an API
- Azure as an API
- VMware via PowerCLI
For example, we audit a vCenter Appliance using the SSH plugin so it connects to vCenter over SSH to perform the audit.
Reporters
InSpec can provide results in a variety of formats such as:
- cli
- json
- yaml
- html,html2
- junit
These are useful for system admins to collect and monitor configuration drift and for accreditation tasks where with the SAF CLI tool you can convert results into a CKL file to import into STIG Viewer.
For more information on reports, see Reporters
Waivers
Waivers allow you do document as code the controls that have a waiver/poam in place for your environment. This is done through a waivers file and provided as an argument at the command line.
Example waivers.yml file
PHTN-30-000053:
  expiration_date: 2024-12-31
  run: false
  justification: "vRA gets it's IP after sshd starts and causes sshd to fail if this is configured to something other than 0.0.0.0:22"
PHTN-30-000106:
  expiration_date: 2024-12-31
  run: false
  justification: "vRA runs Kubernetes which needs this kernel option to forward traffic"
For more information on reports, see Waivers
Running InSpec Examples and Common Arguments
The examples below are for running InSpec from a Windows based machine with the vSphere 7 VCSA profile.
# Run against a target vCenter appliance and output results to CLI
inspec exec C:\Inspec\Profiles\vmware-vcsa-7.0-stig-baseline -t ssh://root@10.1.1.1 --password 'password'

# Run against a target vCenter appliance, show progress, and output results to CLI and JSON
inspec exec C:\Inspec\Profiles\vmware-vcsa-7.0-stig-baseline -t ssh://root@10.1.1.1 --password 'password' --show-progress --reporter=cli json:C:\Inspec\Reports\vcsa.json

# Run against a target vCenter appliance and provide an inputs file
inspec exec C:\Inspec\Profiles\vmware-vcsa-7.0-stig-baseline -t ssh://root@10.1.1.1 --password 'password' --input-file .\inputs-example.yml

# Run against a target vCenter appliance and provide a waivers file
inspec exec C:\Inspec\Profiles\vmware-vcsa-7.0-stig-baseline -t ssh://root@10.1.1.1 --password 'password' --waiver-file .\waiver-example.yml

# Run against a target vCenter appliance and limit the controls run to a single control
inspec exec C:\Inspec\Profiles\vmware-vcsa-7.0-stig-baseline -t ssh://root@10.1.1.1 --password 'password' --controls=VCEM-70-000001

# Run against a target vCenter appliance and limit the controls run that match a regex string
inspec exec C:\Inspec\Profiles\vmware-vcsa-7.0-stig-baseline -t ssh://root@10.1.1.1 --password 'password' --controls=/VCEM-70/
The arguments provided in the example can be combined as needed.
For more options, see InSpec Executable.
References
For the full InSpec documentation, see the InSpec Installation Instructions. For Cinc Auditor, see the Cinc Project Download Page.
3 - Ansible
Ansible is an IT automation tool. It can configure systems, deploy software, and orchestrate more advanced IT tasks such as continuous deployments or zero downtime rolling updates.
Ansible’s main goals are simplicity and ease-of-use. It also has a strong focus on security and reliability, featuring a minimum of moving parts, usage of OpenSSH for transport (with other transports and pull modes as alternatives), and a language that is designed around auditability by humans–even those not familiar with the program.
Ansible concepts talk about “Control nodes” and “Managed nodes”. Controls nodes are the machine that runs Ansible and where it is installed. The managed nodes are systems Ansible is managing and do not require Ansible to be installed.
Prerequisites
- Linux/UNIX only for control nodes.
- Windows is supported for managed nodes only. You can install Ansible on a WSL instance on Windows.
- Python 3.9 or newer for the latest version. More details here.
Installation
Installation of Ansible varies by platform with detailed instructions available here.
Concepts
Playbooks
Ansible Playbooks offer a repeatable, re-usable, simple configuration management and multi-machine deployment system, one that is well suited to deploying complex applications. If you need to execute a task with Ansible more than once, write a playbook and put it under source control. Then you can use the playbook to push out new configurations or confirm the configurations of remote systems.
Playbook structure example:
vmware-photon-4.0-stig-ansible-hardening
├── defaults
│   └── main.yml
├── handlers
│   └── main.yml
|── meta
│   └── main.yml
├── tasks
│   ├── main.yml
│   └── photon.yml
├── templates
│   ├── audit.STIG.rules
│   └── issue
├── vars
│   └── main.yml
└── playbook.yml
└── requirements.yml
└── vars-example.yml
By default Ansible will look in each directory for a main.yml file.
The purpose of each folder is as follows:defaults/main.yml - Default variables for the role/playbook. These variables have the lowest priority of any variables available, and can be easily overridden by any other variable. We use these variables to enable/disable STIG controls individually.handlers/main.yml - Sometimes you want a task to run only when a change is made on a machine. For example, you may want to restart a service if a task updates the configuration of that service, but not if the configuration is unchanged. Ansible uses handlers to address this use case. Handlers are tasks that only run when notified.meta/main.yml - metadata for the role, including role dependencies and optional Galaxy metadata such as platforms supported.tasks/main.yml - The main list of tasks that the playbook executes.templates - Templates that the playbook uses. For example, any complete files we may be replacing instead of editing.vars/main.yml - Other variables for the role. We place variables for setting values in here. For example, variables for syslog or ntp servers.playbook.yml - A list of plays that define the order in which Ansible performs operations, from top to bottom, to achieve an overall goal.requirements.yml - Some playbooks may depend on collections or other roles and are specified here for installation with the ansible-galaxy command.vars-example.yml - We may provide example vars files to use and customize when running a playbook for your environment. This is where we would recommend specifying any variable values instead of editing the playbook files themselves.
Roles
Ansible roles can be thought of as playbooks inside of playbooks and meant to be reusable. Our Photon OS playbooks may be a dependency in another playbook and used as a role so that we do not have to maintain multiple copies of the Photon playbook.
They have the same folder structure as a playbook and will be inside a roles folder in the playbook or specified as a dependency in the playbook.yml.
Example playbook.yml with roles. Note the Photon role is external to this playbooks structure.
- name: vmware-vcsa-8.0-stig-ansible-hardening
  hosts: all
  roles:
    - role: vmware-photon-3.0-stig-ansible-hardening
      vars:
        var_syslog_authpriv_log: '/var/log/audit/sshinfo.log'
    - role: eam
    - role: envoy
    - role: lookup
    - role: perfcharts
    - role: postgresql
    - role: sts
    - role: ui
    - role: vami
Collections/Modules
A format in which Ansible content is distributed that can contain playbooks, roles, modules, and plugins. You can install and use collections through Ansible Galaxy.
In this project we primarily use collections to install modules which are the code or binaries that Ansible copies to and executes on each managed node (when needed) to accomplish the action defined in each Task. Each module has a particular use, from administering users on a specific type of database to managing VLAN interfaces on a specific type of network device.
In the example below we are using the ansible.builtin.template module.
###################################################################################################################################
- name: PHTN-40-000003 - Update audit.STIG.rules file
  tags: [PHTN-40-000003, PHTN-40-000019, PHTN-40-000031, PHTN-40-000076, PHTN-40-000078, PHTN-40-000107, PHTN-40-000173, PHTN-40-000175, PHTN-40-000204, PHTN-40-000238, auditd]
  when: run_auditd_rules | bool
  block:
    - name: PHTN-40-000003 - Copy auditd rules template
      ansible.builtin.template:
        src: audit.STIG.rules
        dest: '{{ var_auditd_rule_file }}'
        owner: root
        group: root
        mode: '0640'
        force: true
      notify:
        - reload auditd
For a list of all available modules, see Index of all Modules.
Installing Collections and Roles
# Install a collection directly from ansible galaxy
ansible-galaxy collection install ansible-posix

# Install a collection from a downloaded tar.gz
ansible-galaxy collection install ansible-posix-1.5.4.tar.gz

# Install a role from a downloaded tar.gz of the role
ansible-galaxy role install --roles-path /usr/share/ansible/roles vmware-photon-3.0-stig-ansible-hardening-v1r9.tar.gz
Tags
Tags in Ansible offer a way to only run a specific task or exclude tasks. In the playbooks provided we tag tasks with STIG IDs and sometimes a category such as sshd if there are many tasks that touch ssh.
When running a playbook you can specify --tags or --skip-tags at the cli followed by a list of tags.
Inventory
Ansible automates tasks on managed nodes or “hosts” in your infrastructure, using a list or group of lists known as inventory. You can pass host names at the command line, but most Ansible users create inventory files. Your inventory defines the managed nodes you automate, with groups so you can run automation tasks on multiple hosts at the same time. Once your inventory is defined, you use patterns to select the hosts or groups you want Ansible to run against.
The examples we provide in this documentation just pass host names at the command line but if creating inventory files is desired that can be done as well but is outside of the scope here.
For more information on inventory, see Building Ansible inventories.
Check mode
Check mode runs a playbook and simulates the results. Not all modules support check mode and we do not write our playbooks with check mode in mind.
Running Ansible Examples and Common Arguments
The examples below are for running Ansible with the vSphere 8 VCSA profile.
# Run all controls on a target vCenter. Prompts for user password(-k), displays verbose output(-v).
ansible-playbook -i '10.1.1.1', -u 'root' /path/to/vmware-vcsa-8.0-stig-ansible-hardening/playbook.yml -k -v

# Specify a vars files to pass variables to the playbook.
ansible-playbook -i '10.1.1.1', -u 'root' /path/to/vmware-vcsa-8.0-stig-ansible-hardening/playbook.yml -k -v --extra-vars @/path/to/vmware-vcsa-8.0-stig-ansible-hardening/vars-example.yml

# Specify a tag to only run tasks that match the tag.
ansible-playbook -i '10.1.1.1', -u 'root' /path/to/vmware-vcsa-8.0-stig-ansible-hardening/playbook.yml -k -v --tags VCEM-80-000001

# Specify a tag to skip tasks that match the tag.
ansible-playbook -i '10.1.1.1', -u 'root' /path/to/vmware-vcsa-8.0-stig-ansible-hardening/playbook.yml -k -v --skip-tags VCEM-80-000001
The arguments provided in the example can be combined as needed.
For more options, see ansible-playbook.
Host Key Checking
Ansible enables host key checking by default. Checking host keys guards against server spoofing and man-in-the-middle attacks. If a host is not trusted before running Ansible you may see an error that the authenticity of the host cannot be verified.
This can be corrected by running the following:
ssh-keyscan -H <IP or FQDN> >> /root/.ssh/known_hosts
See managing-host-key-checking for more details.
References
For the full Ansible documentation, see Ansible Documentation.
4 - SAF CLI
The MITRE Security Automation Framework (SAF) Command Line Interface (CLI) brings together applications, techniques, libraries, and tools developed by MITRE and the security community to streamline security automation for systems and DevOps pipelines.
In this context the SAF CLI is used for the following tasks:
- Creating and applying manual attestations to InSpec results.
- Converting InSpec results to a STIG checklist(CKL) format.
- Converting STIG XCCDF files to InSpec profiles to stub out a new profile.
Prerequisites
- Windows, Linux, and MAC are supported.
Installation
Download the package for your OS for a release here.
For a full list of installation options, see Installation.
Usage
Creating and applying manual attestations
Manual attestation is helpful in scenarios where a control can’t be automated for some reason(no API, policy based, etc) but you would still like to include an evaluation of these controls with your automated reports.
The example covered will work with InSpec results but this process can be applied to any report from various supported security tools in the SAF ecosystem.
Creating a manual attestation file
An attestation file can be created using SAF CLI or by just manually creating a file.
Using SAF CLI to create a file
# Provide your report.json as input and in this example we are using yml as the format but json is also supported
saf attest create -i .\vSphere_ESXi_8.0.1_GA_21495797_ootb_04-12-2023-09-05.json -o .\attestation-example.yml -t yml

# You can search for controls by entering a partial STIG ID
Enter a control ID, search for a control, or enter 'q' to exit: esxi-80-00000
        ESXI-80-000005: The ESXi host must enforce the limit of three consecutive invalid logon attempts by a user.
        ESXI-80-000006: The ESXi host must display the Standard Mandatory DOD Notice and Consent Banner before granting access to the system via the Direct Console User Interface (DCUI).
        ESXI-80-000008: The ESXi host must enable lockdown mode.
# For the control you want to attest to you must enter the control ID exactly since this is case sensitive. You will then be prompted to fill out some questions.
Enter a control ID, search for a control, or enter 'q' to exit: ESXI-80-000006
Attestation explanation: The banner is displayed
Frequency (1d/3d/1wk/2wk/1m/3m/6m/1y/1.5y/custom): 1y
Enter status ((p)assed/(f)ailed): passed
Updated By: RL
Enter a control ID, search for a control, or enter 'q' to exit: q
This results in a yaml file that looks like the following:
- control_id: ESXI-80-000006
  explanation: The banner is displayed
  frequency: 1y
  status: passed
  updated: 2023-05-17T13:32:32.945Z
  updated_by: RL
Now that you know the format it may be easier to just add all of the controls needing manual attestation to the attestation file directly.
Applying an attestation file to a result file
The next step is to apply the attestation file to our original report to then create a new one that includes our manual attestations.
# Provide the original report followed by the attestation file created then for the output provide a name for a new report
saf attest apply -i .\vSphere_ESXi_8.0.1_GA_21495797_ootb_04-12-2023-09-05.json .\attestation-example.yml -o .\My_new_report_with_attestations.json
If we examine the new report we will see this on the control we provided an attestation for:
{
  "code_desc": "Manually verified status provided through attestation",
  "status": "passed",
  "message": "Attestation:\nStatus: passed\nExplanation: The banner is displayed\n\nUpdated: 2023-05-17T13:32:32.945Z\nUpdated By: RL\nFrequency: 1y",
  "start_time": "2023-05-17T13:49:06.601Z"
}
Now when we convert this to a CKL file this information will be carried forward.
Converting InSpec results to CKL
saf convert hdf2ckl -i .\My_new_report_with_attestations.json -o my_new_ckl.ckl --hostname myesxihost --fqdn myesxihost.local --ip 10.1.2.3 --mac 00:00:00:00:00:00
After importing into STIG viewer you can see the manual attestation on the ESXI-80-000006 in the finding details.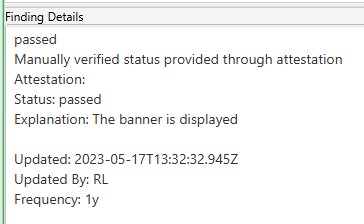
The host info provided is also populated in the target data.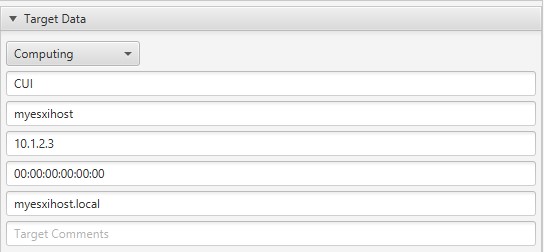
Converting XCCDF to InSpec
When starting a new profile for a STIG it would not be feasible to manually populate all of a STIGs metadata (title,check,fix,discussion,ids,severity,etc) into the control files.
SAF CLI offers a command to take an XCCDF xml file from a STIG as an input and output a stubbed out InSpec profile that includes all of this data where you then only need to add your tests for each control.
# The -T argument sets which ID to use as the control ID for InSpec. In this case we prefer STIG IDs as they are easier to reference. Other options are rule(Rule ID) and group(Vul ID)
saf generate xccdf_benchmark2inspec_stub -T version -i .\U_VMware_vSphere_8_ESXi_STIG_Readiness_Guide_V1R1-xccdf.xml -o my_esxi_profile
This will give us a profile with this folder structure:
my_esxi_profile
├── controls
│   ├── ESXI-80-000005.rb
│   └── ESXI-80-000006.rb
│   └── ...
├── libraries
└── inspec.yml
Control file example:
control 'ESXI-80-000005' do
  title 'The ESXi host must enforce the limit of three consecutive invalid logon attempts by a user.'
  desc 'By limiting the number of failed logon attempts, the risk of unauthorized access via user password guessing, otherwise known as brute forcing, is reduced. Once the configured number of attempts is reached, the account is locked by the ESXi host.'
  desc 'check', 'From the vSphere Client, go to Hosts and Clusters.

Select the ESXi Host >> Configure >> System >> Advanced System Settings.

Select the "Security.AccountLockFailures" value and verify it is set to "3".

or

From a PowerCLI command prompt while connected to the ESXi host, run the following command:

Get-VMHost | Get-AdvancedSetting -Name Security.AccountLockFailures

If the "Security.AccountLockFailures" setting is set to a value other than "3", this is a finding.'
  desc 'fix', 'From the vSphere Client, go to Hosts and Clusters.

Select the ESXi Host >> Configure >> System >> Advanced System Settings.

Click "Edit". Select the "Security.AccountLockFailures" value and configure it to "3".

or

From a PowerCLI command prompt while connected to the ESXi host, run the following command:

Get-VMHost | Get-AdvancedSetting -Name Security.AccountLockFailures | Set-AdvancedSetting -Value 3'
  impact 0.5
  tag check_id: 'N/A'
  tag severity: 'medium'
  tag gid: 'V-ESXI-80-000005'
  tag rid: 'SV-ESXI-80-000005'
  tag stig_id: 'ESXI-80-000005'
  tag gtitle: 'SRG-OS-000021-VMM-000050'
  tag documentable: nil
  tag cci: ['CCI-000044']
  tag nist: ['AC-7 a']
end
References
For the more information, see the SAF CLI Documentation.
5 - Heimdall
MITRE’s Heimdall Server allows you to visualize, store, and compare scan results from various security tools.
Prerequisites
- Infrastructure to deploy Heimdall Server on.
Installation
Heimdall is most easily deployed via Docker or Kubernetes.
Demo instances are available at Heimdall Lite or Heimdall.
Note: The demo environments are for demonstration use only, please do not provide any personal identifying information or load real mission data into this system, even if the data is from non-production environments.
For a full list of installation options, see Installation.
Usage
All of the documentation below will be in the context of working with InSpec results. Using results from other tools may vary.
Viewing Results
After login in you can simply drag your files over to the window to load or click “Choose files to upload” and browse to your result file.
After loading a result you are shown a visualization of that result where you can view the compliance status and filter the results based on any available criteria, for example, only showing controls that failed.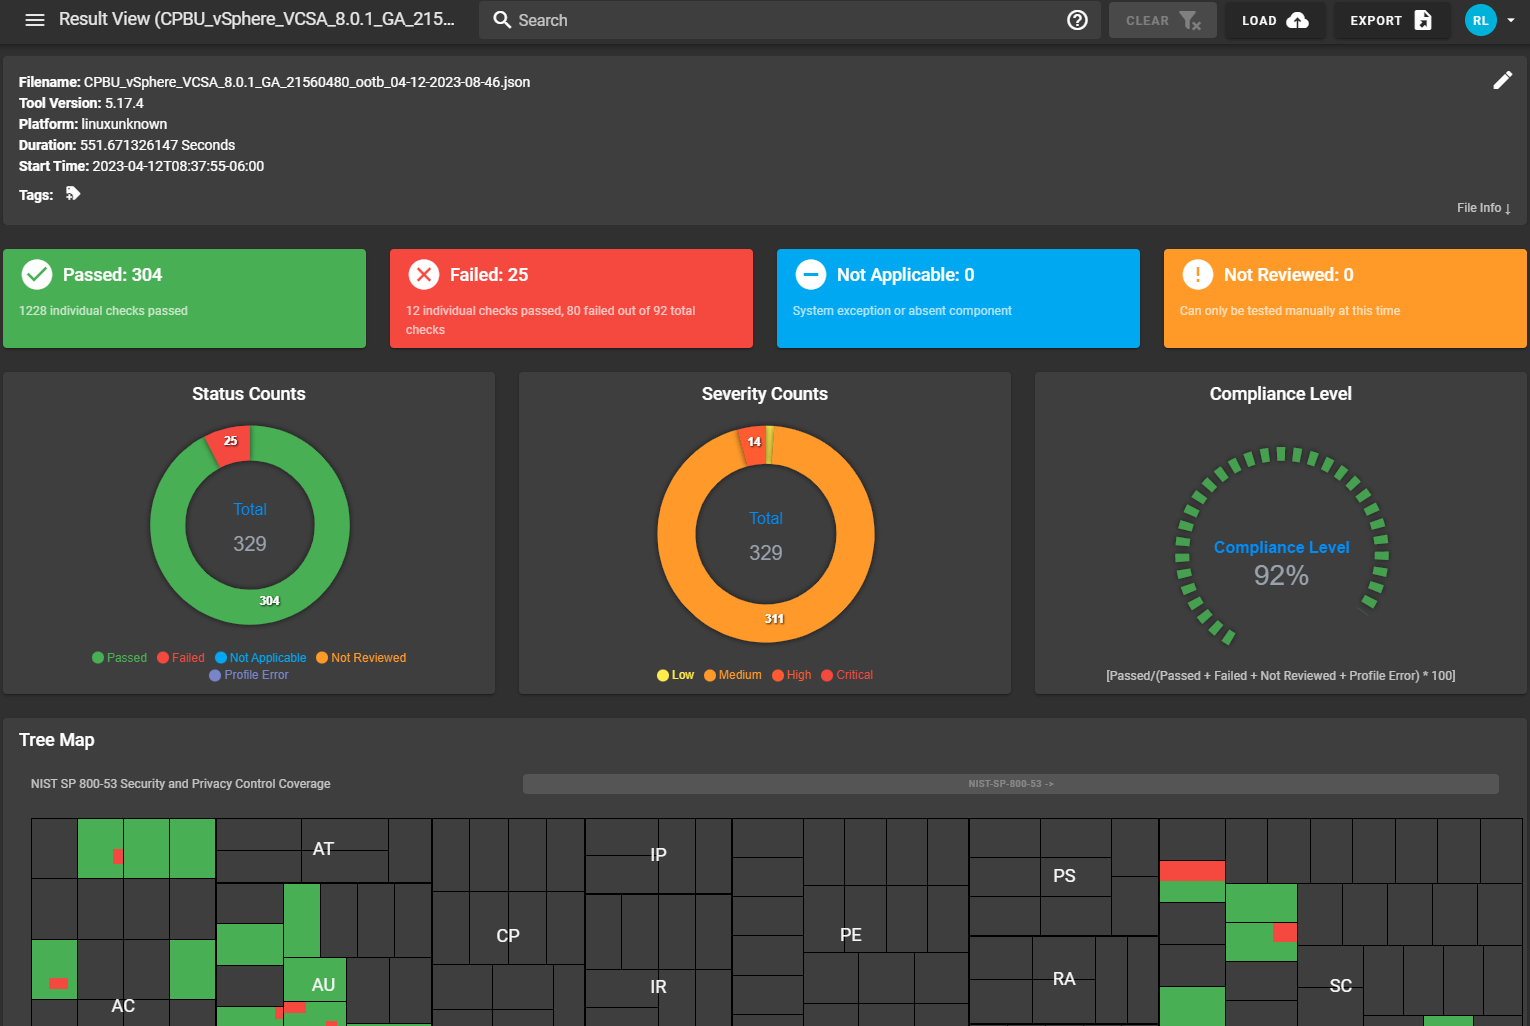
Further down the page you can drill down into the specifics of each control and the test results.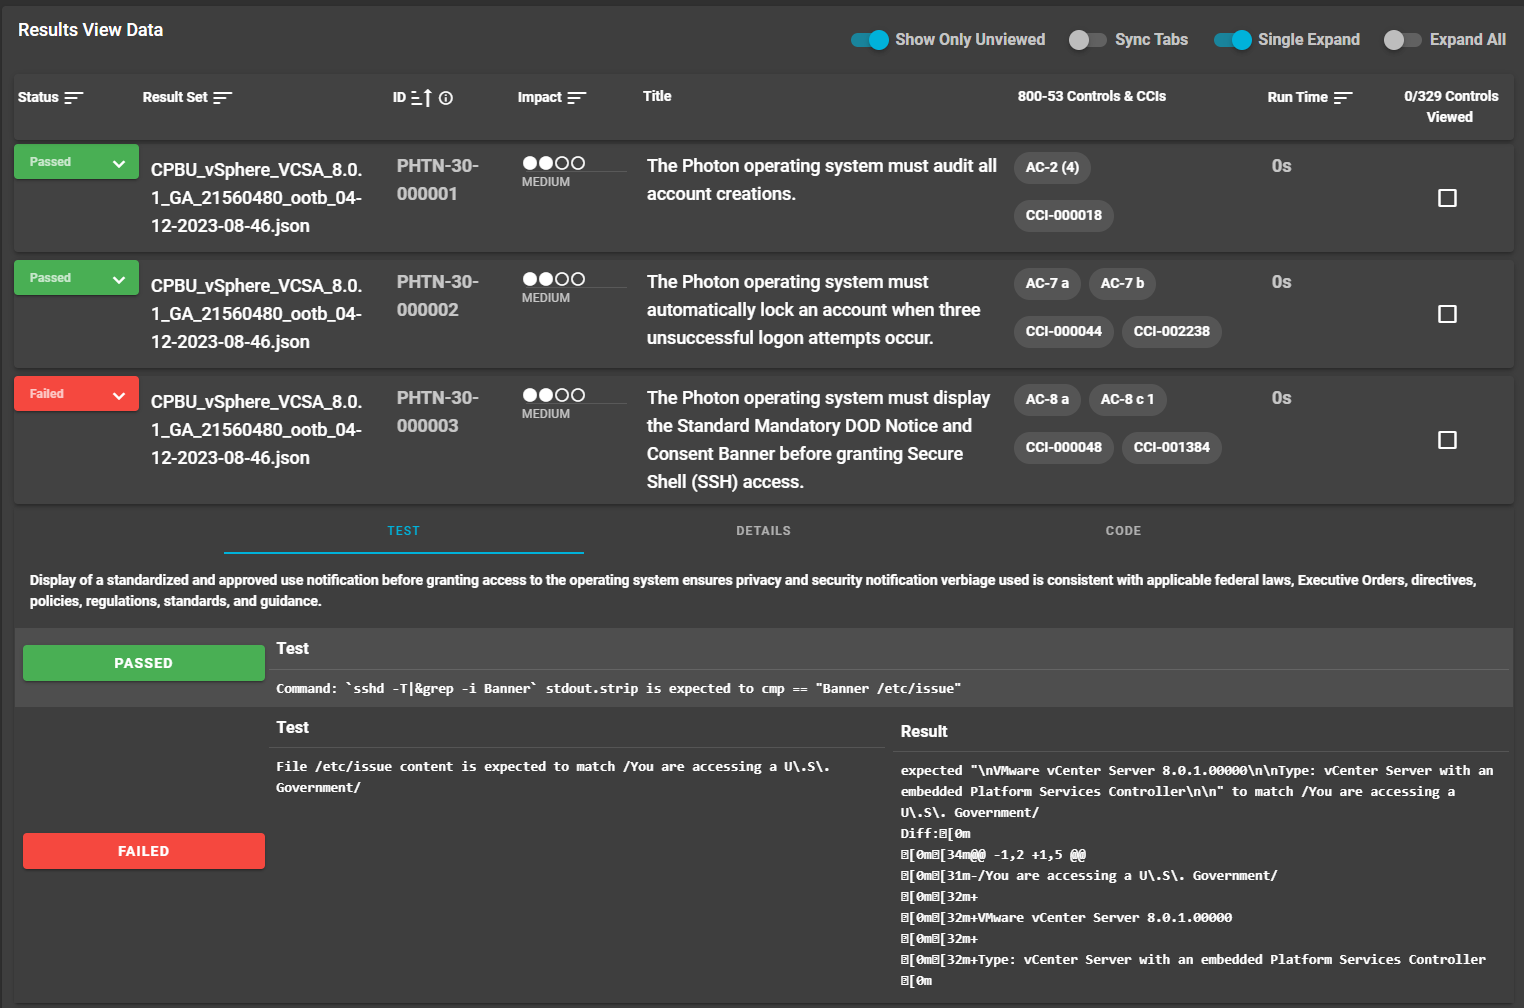
Exporting Results
Results can also be exported to various other formats as shown in the screenshot below.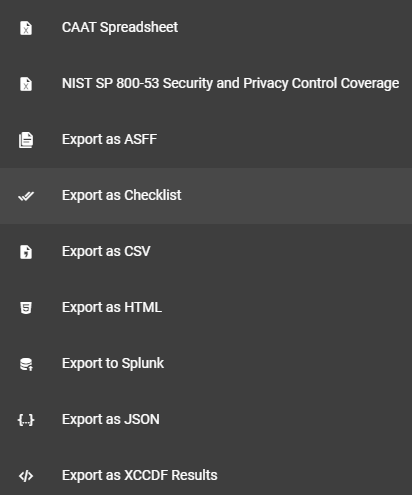
Comparing Results
If you have more than one scan you would like to compare from like scan results you can load them both and enable the comparison view using the button show below.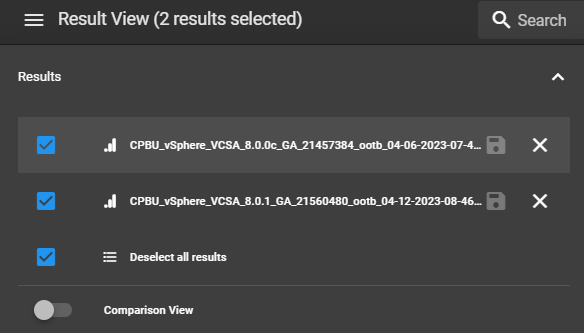
After the comparison view is enabled you are presented with visualization of the differences between the two results and which controls changed status.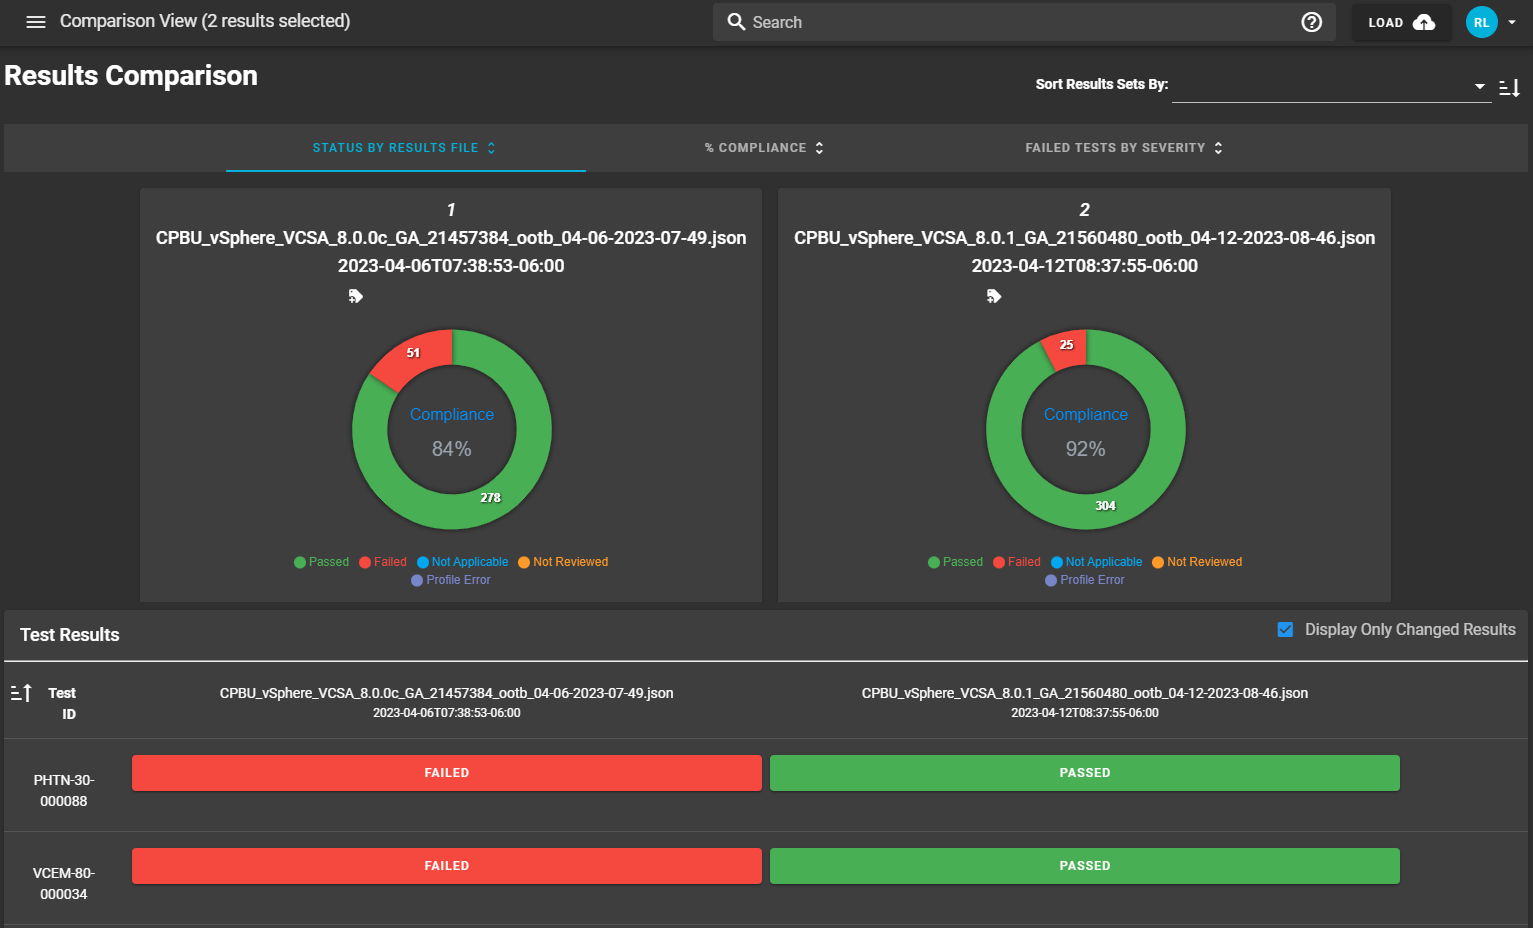
References
For the more information, see the Heimdall Github Page.